
Film Profitability Analysis
Overview
Using data on the top 10,000 most popular films taken from The Movie Database (themoviedb.org), I will use Google Sheets to identify insights which could help a hypothetical movie studio create a profitable movie.
- Technology: Google Sheets
- Timeline: 1 week
- Role: Data Analyst
- Date Completed: July 2023
The Business Task
Identify common attributes for the most profitable films.
Approach & Workflow
This project demonstrates the transition of raw, unstructured movie data into a functional Business Intelligence (BI) dashboard. Even though this was built in a spreadsheet environment, I followed a standard data pipeline to ensure the results were accurate and actionable.
The Data Pipeline
- Integrity Audit: I performed a manual data cleaning phase to identify and remove “noise,” such as films with $0 budgets or incomplete revenue strings, which would have compromised the ROI calculations.
- Logic & Aggregation: I utilized
AVERAGEIFSandSUMIFSto create dynamic summary tables. This allowed me to “Group” data by genre and year, similar to the logic of a SQLGROUP BYclause to see high-level trends. - Feature Engineering: I created custom calculated fields for Net Profit and ROI (%). These metrics allowed for an analysis centered around actual investment efficiency.
Dashboard & Reporting
- Dynamic UI: Using Data Validation and dropdown menus, I built an interactive interface that allows users to filter the entire dataset by specific criteria.
- Statistical Segmentation: I applied sorting and percentile logic to isolate the “Top 20%” of performers. This helped visualize the difference between “reliable earners” (like Horror) and “high-risk blockbusters” (like Adventure).
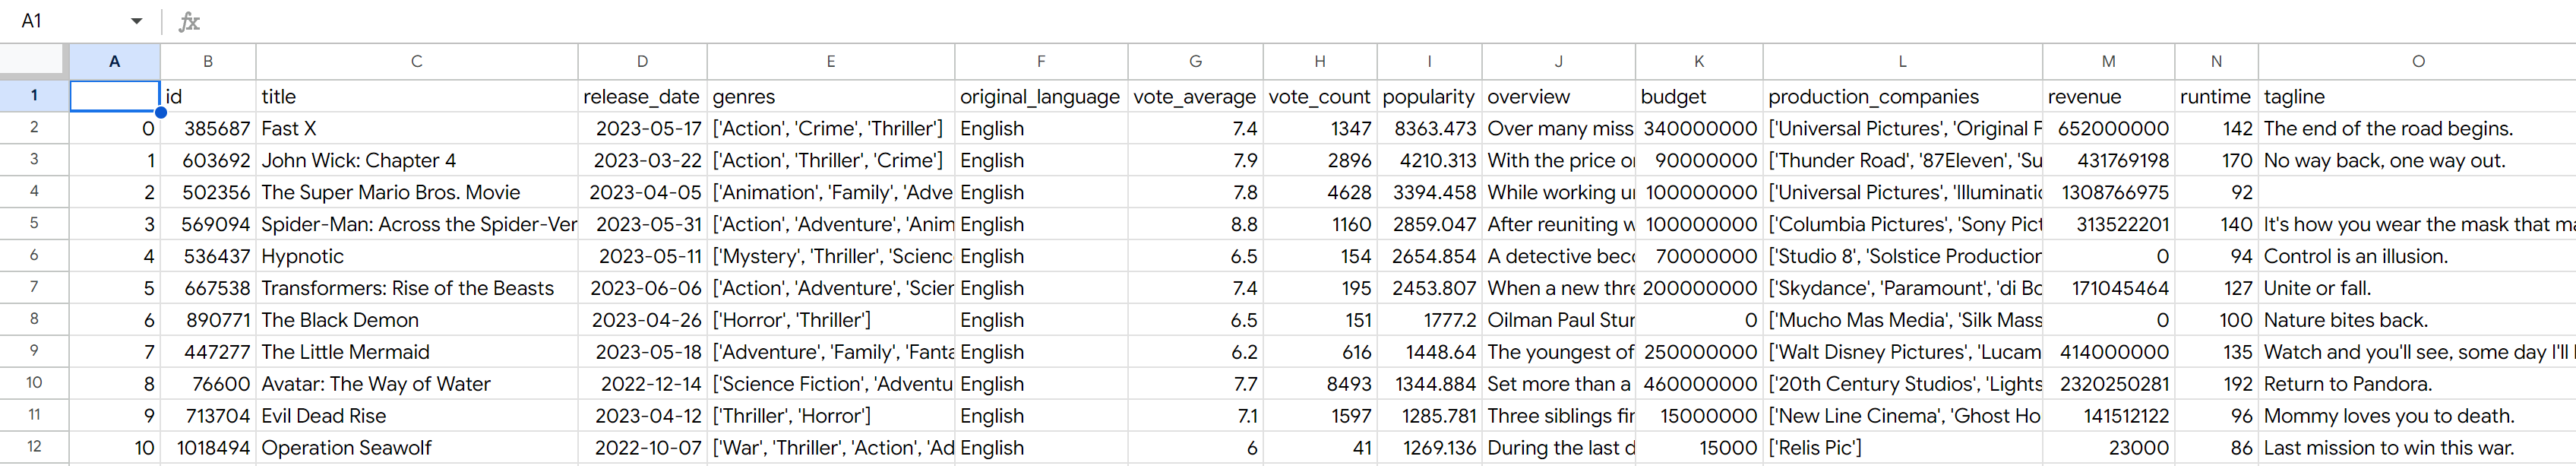
The Data
The data is taken from The Movie Database, which is a community-built movie and TV database. This data was collected by user Mahesh Jadhav and made publicly available on Kaggle. Mahesh collected data on the top 10,000 most popular films on the website, where popularity is defined by TMDB based on user engagement.
Columns:
- id: Unique identifier assigned to each movie in the TMDB database.
- title: Title of the movie.
- release_date: Date on which the movie was released.
- genres: List of genres associated with the movie.
- original_language: Language in which the movie was originally produced.
- vote_average: Average rating given to the movie by TMDB users.
- vote_count: Number of votes cast for the movie on TMDB.
- popularity: Popularity score assigned to the movie by TMDB based on user engagement.
- overview: Brief description or synopsis of the movie.
- budget: Estimated budget for producing the movie in USD.
- production_companies: List of production companies involved in making the movie.
- revenue: Total revenue generated by the movie in USD.
- runtime: Total runtime of the movie in minutes.
- tagline: Short, memorable phrase associated with the movie, often used in promotional material.
Because the dataset is comprised of 10,000 of the most popular films at the time the data was collected, there is an undeniable bias towards more recent films. This will skew all further analysis because successful films are over-represented compared to unsuccessful ones. This also limits our ability to analyze year-over-year growth in the film industry as older movies are under-represented. Since we are looking to emulate past successes and not past failures, we will still be able to make use of the averages of films in this dataset.
Data Cleaning
Removing Excessive Columns
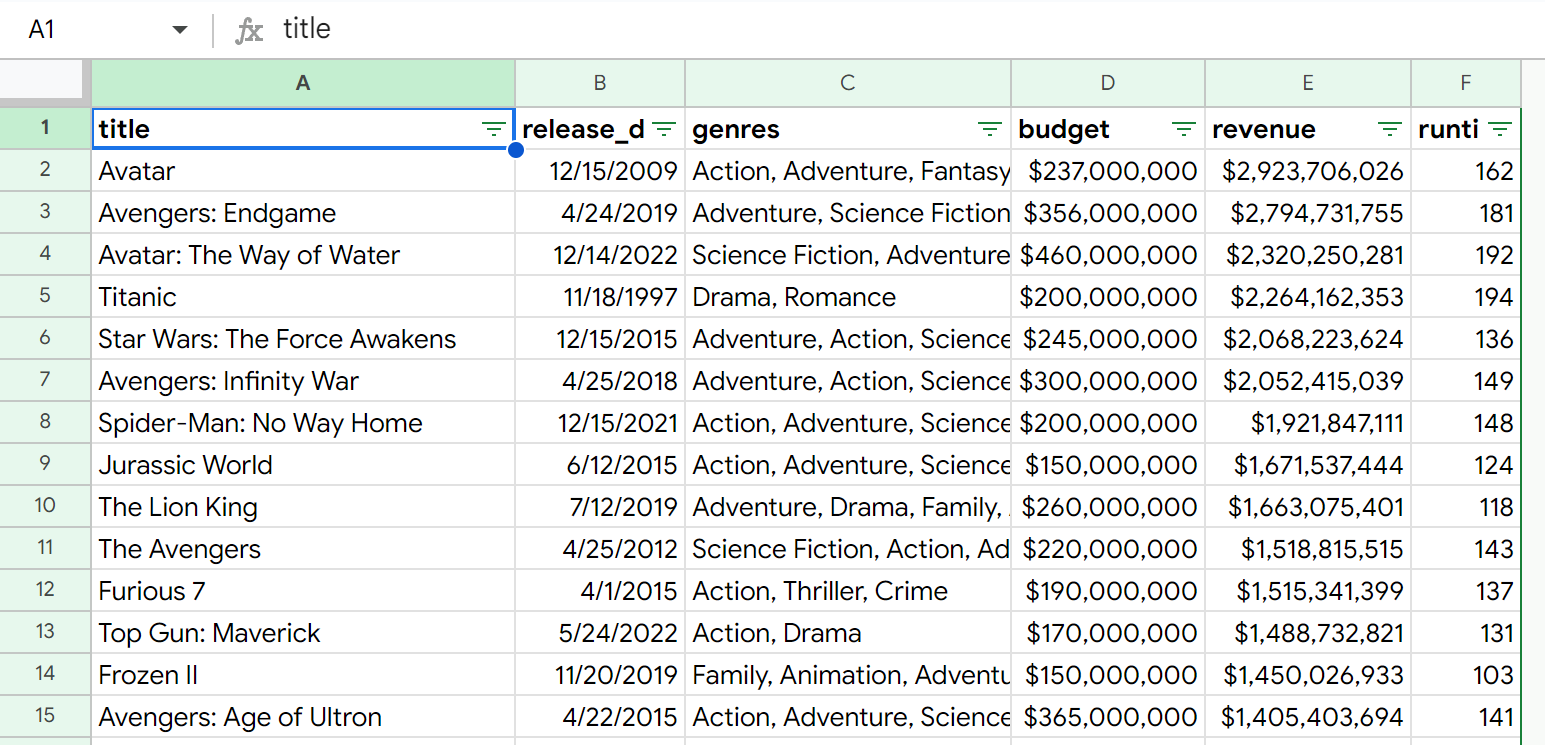
First, I’ll delete the index, original_language, vote_average, vote_count, popularity, overview, production companies and tagline columns, as they are unnecessary to our analysis.
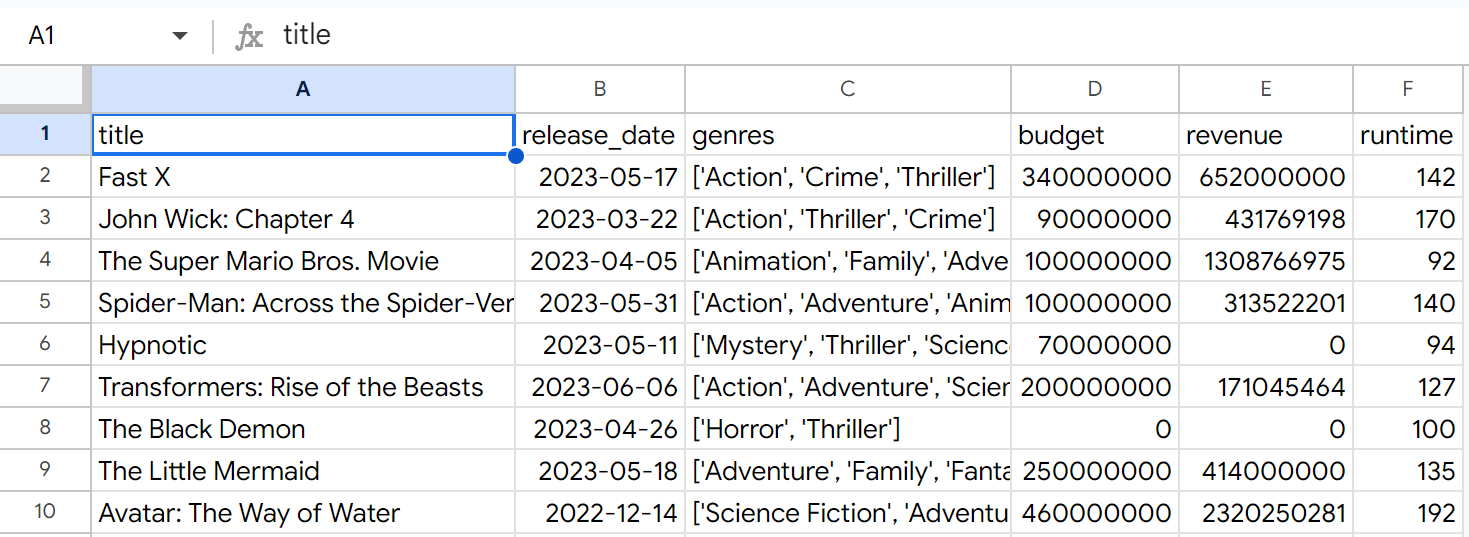
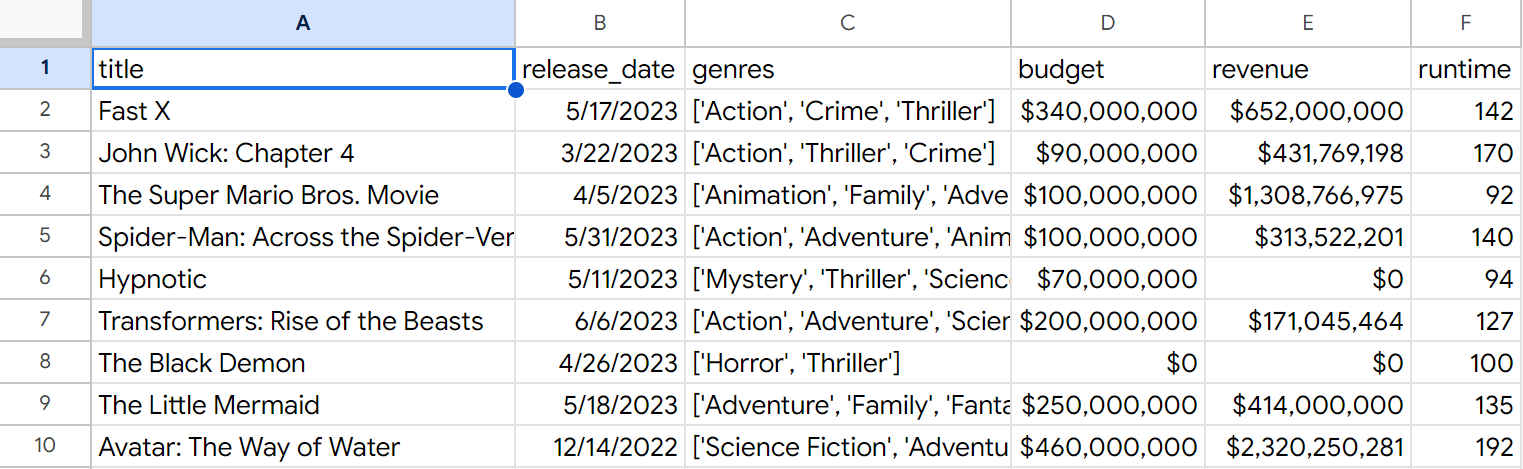
Correcting Data Types
Next, I’ll change all columns to the following data types:
- title: plain text
- release_date: date
- genres: plain text
- budget: currency
- revenue: currency
- runtime: number
Removing Rows with Incomplete Data
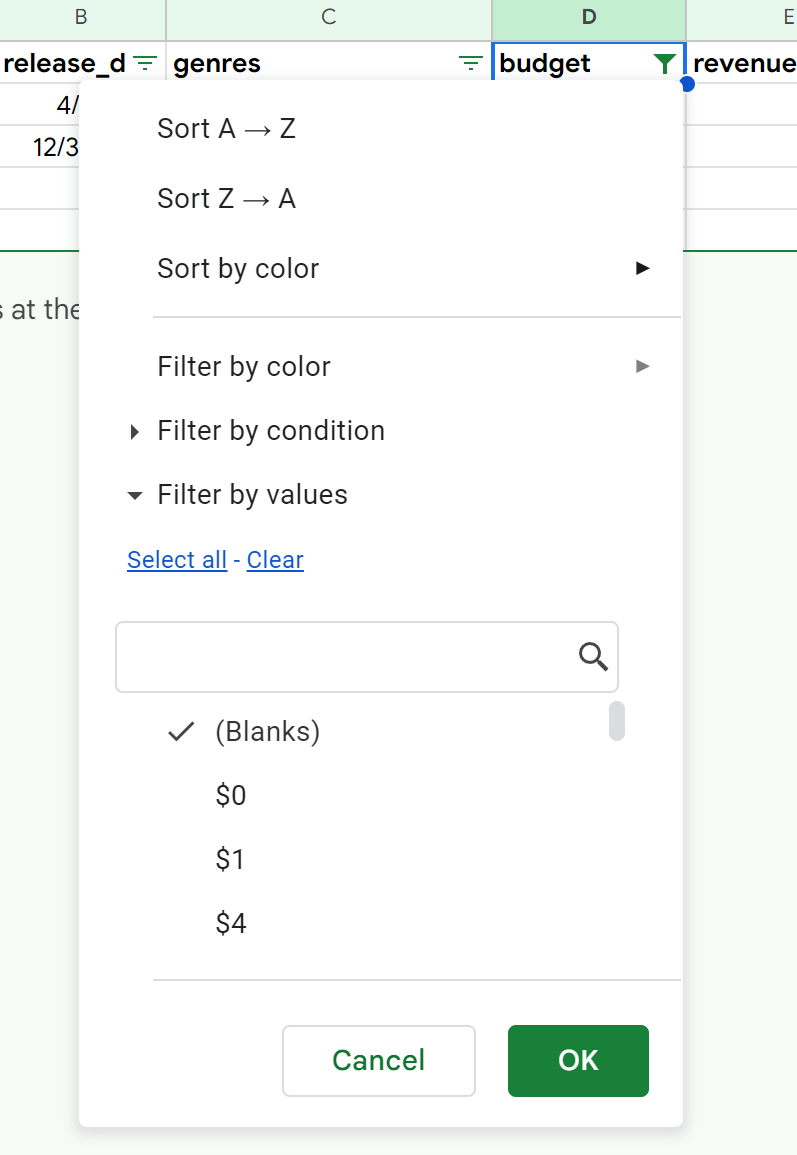
Seeing a significant amount of 0 values for budget and revenue, I’ll start by cleaning those columns first
Filtering by blank budget values, I find 4 rows to delete.
Filtering by budget <$500, I can delete 4,668 rows
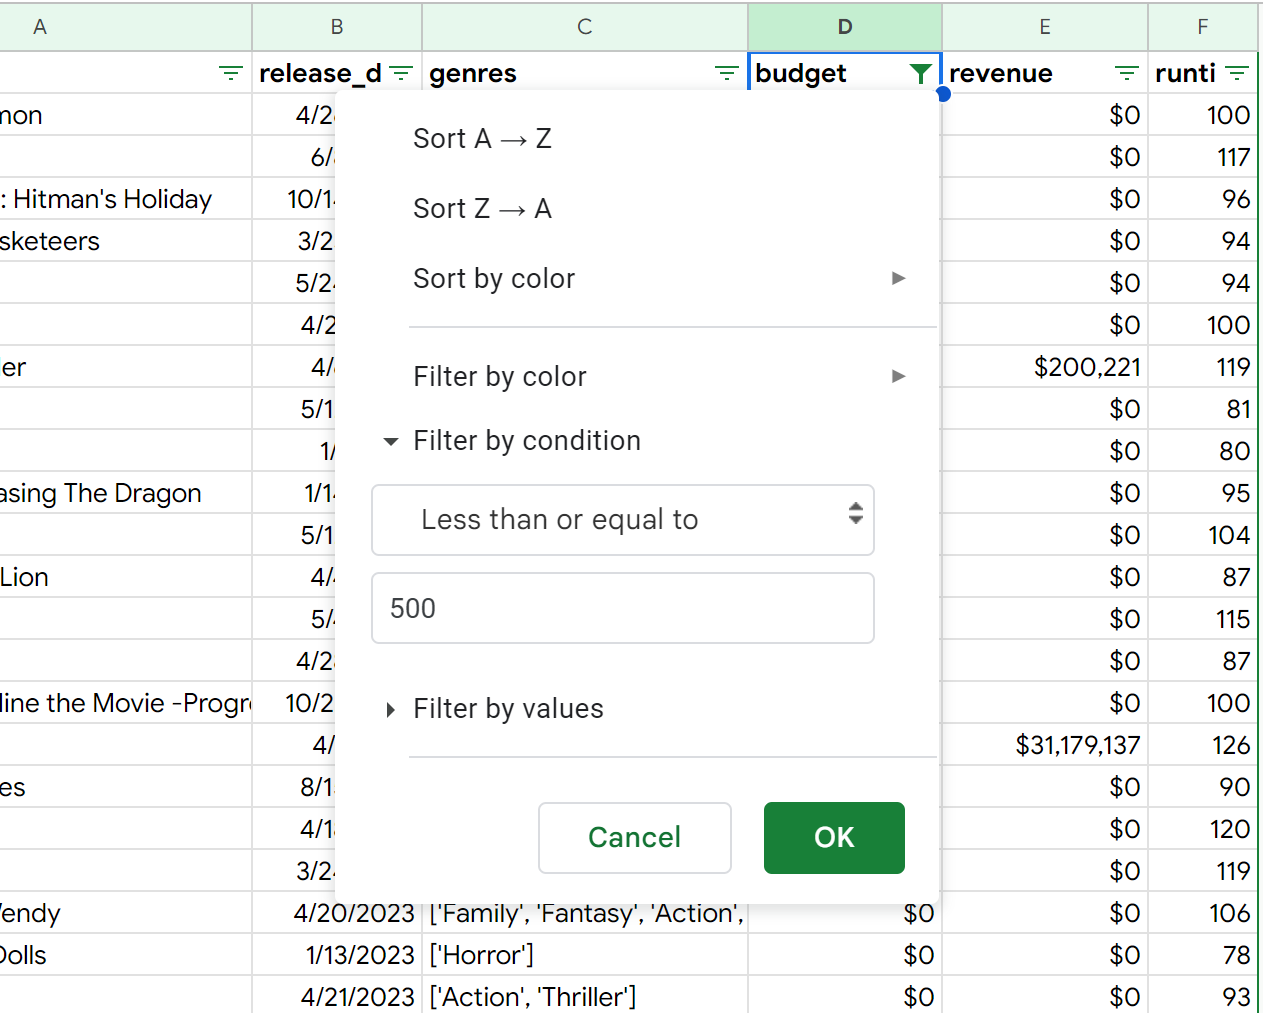
I repeat this process on the revenue column, deleting all values less than $500.
There are 4,670 rows remaining
Next, I’ll check for rows with missing values in any of the following columns:
- title: none found
- release_date: none found
- genres: none found
- runtime: none found
Removing Unnecessary Characters
Using Find and Replace, I’ll remove the brackets and single quotes from the genres column.
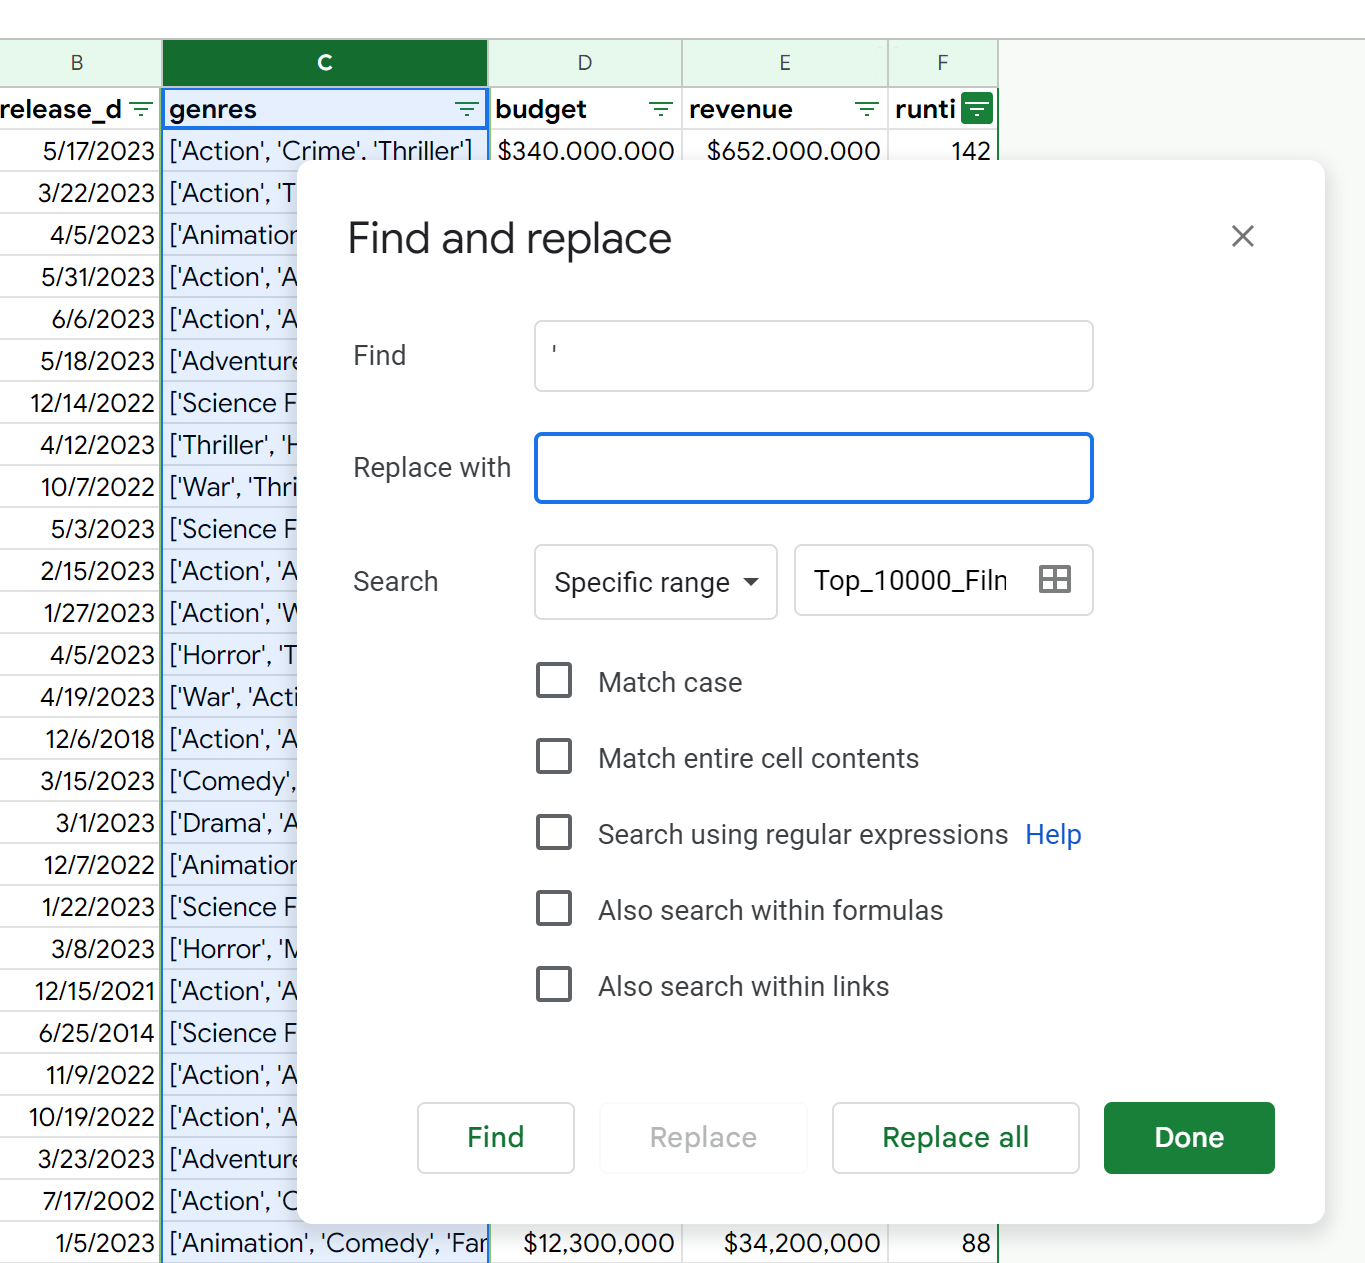
Having finished all this, the data is now clean. We are left with 4,670 rows and 6 columns.
Processing
Profit Column
First, I’ll create a column for profit. This will be calculated by subtracting the budget from revenue.
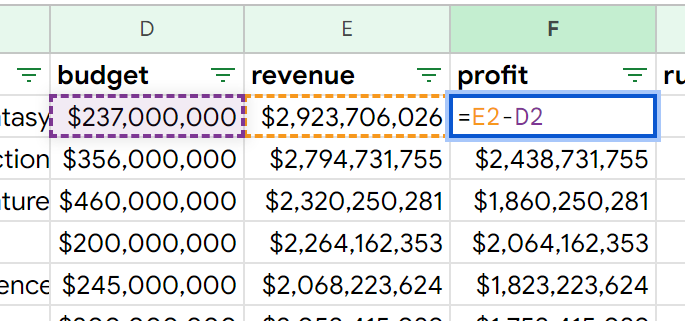
=E2-D2
ROI Column
Next, I’ll create a new column called ROI. This is revenue divided by budget represented as a percentage. Anything lower than 100% lost money at the box office.
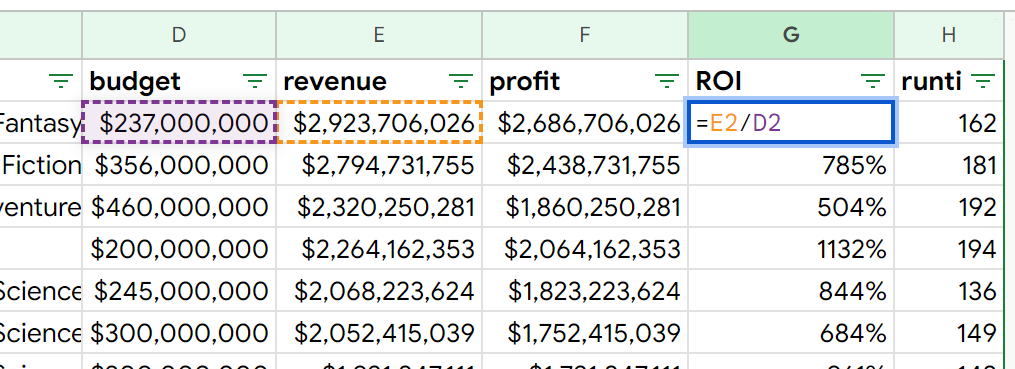
=E2/D2
Release Year Column
Next, I’ll create a release_year column.
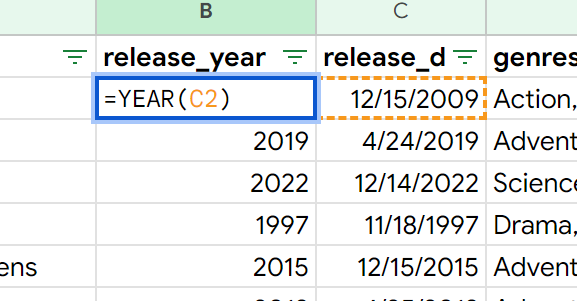
=YEAR(C2)
Release Month Column
I’ll also create a release_month column.
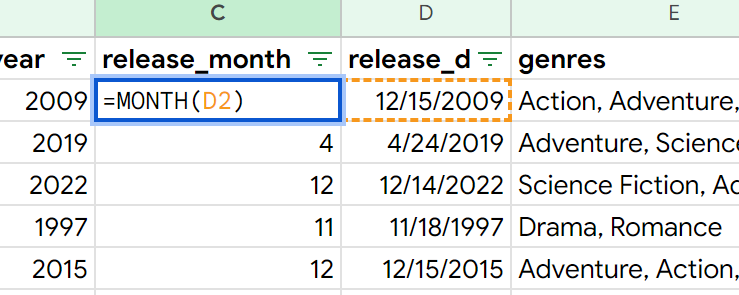
=MONTH(D2)
Weekday Column
Finally, I’ll create a weekday column.
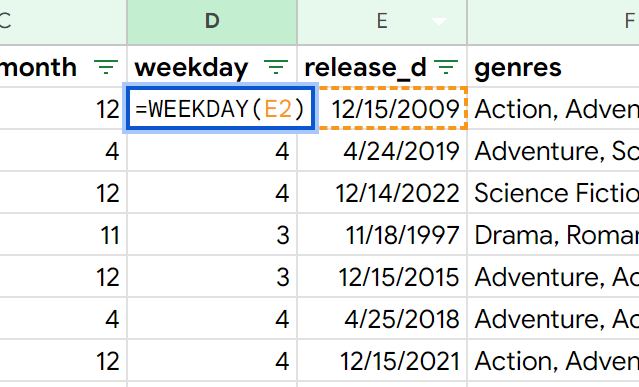
=WEEKDAY(D2)
Translating Release Year, Month, and Weekday Columns
I’ll copy these three columns and use Paste special > Values only to remove their dependency on the release_date column.
I’ll select the release_month column, and use Find and Replace to replace each number with its corresponding month. [1 = January, 2 = February, 3 = March, …]
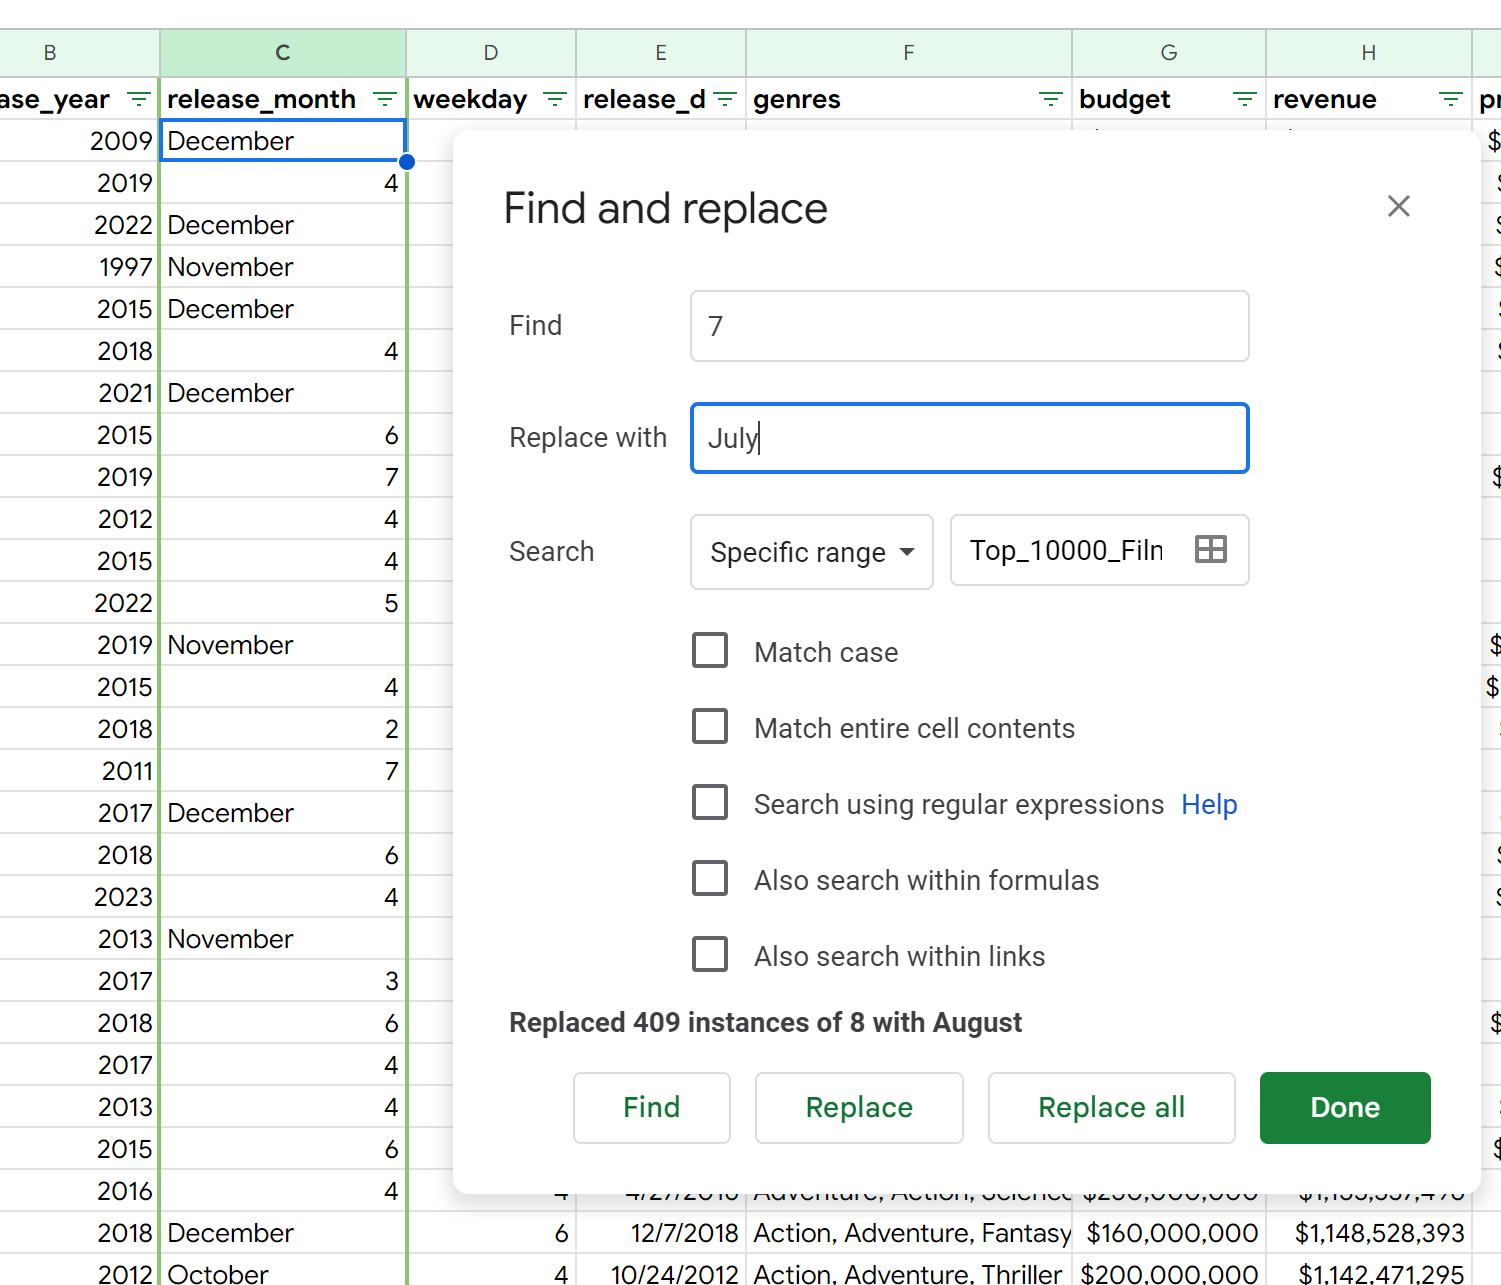
By starting with December, November and October, I can avoid issues such as incorrectly replacing “11” with “JanuaryJanuary” I’ll repeat the same process to convert the weekday column into their proper names.
Percentile Columns
Now, I’d like to create some rankings of our films.
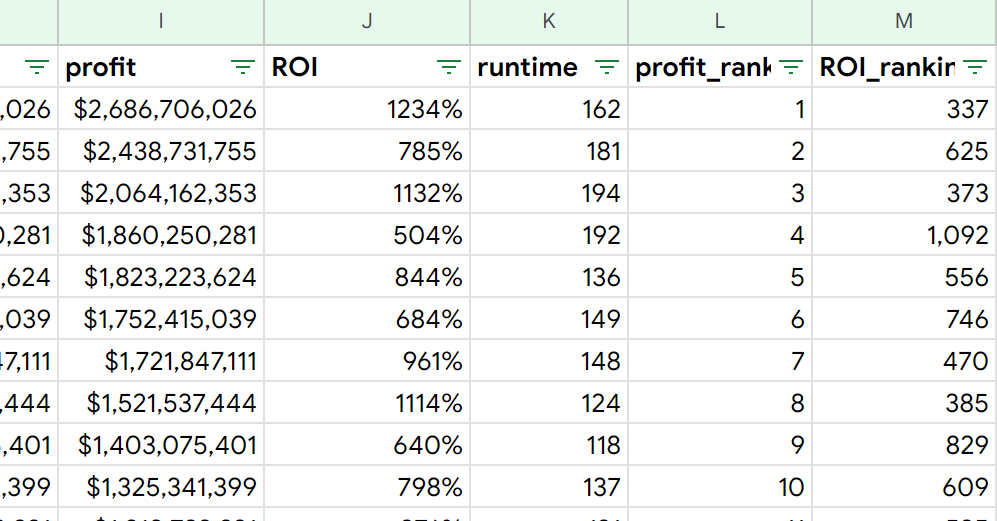
First, I’ll filter our data by descending profit, so our highest profit films are at the top.
Next, I’ll create a new column, called profit_ranking, and adding a numerical ranking to this column
Now, I want to repeat this same process, only instead of ranking by profit, I’ll be ranking by ROI, and naming this column ROI_ranking.
Now, I’ll create another column called profitable. This column will display “T” if the movie made any money. If not, it will display “F”.
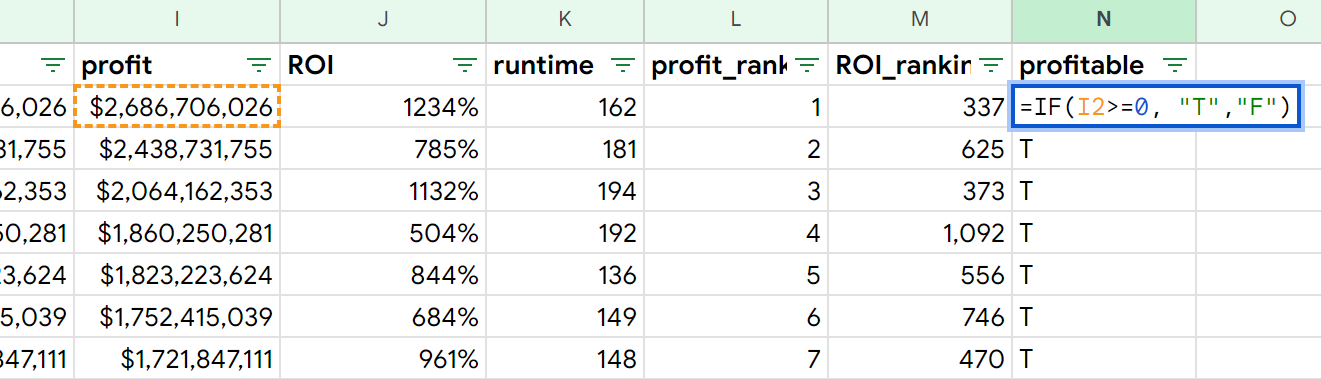
=IF(I2>=0, "T", "F")
Using the columns we just created, I’ll be able to create a percentile for each row. I want my percentile calculations to only include films that are profitable, so I’ll use the number of “T” values in the profitable column to serve as the denominator. The result is two new columns: profit_percentile and ROI_percentile.
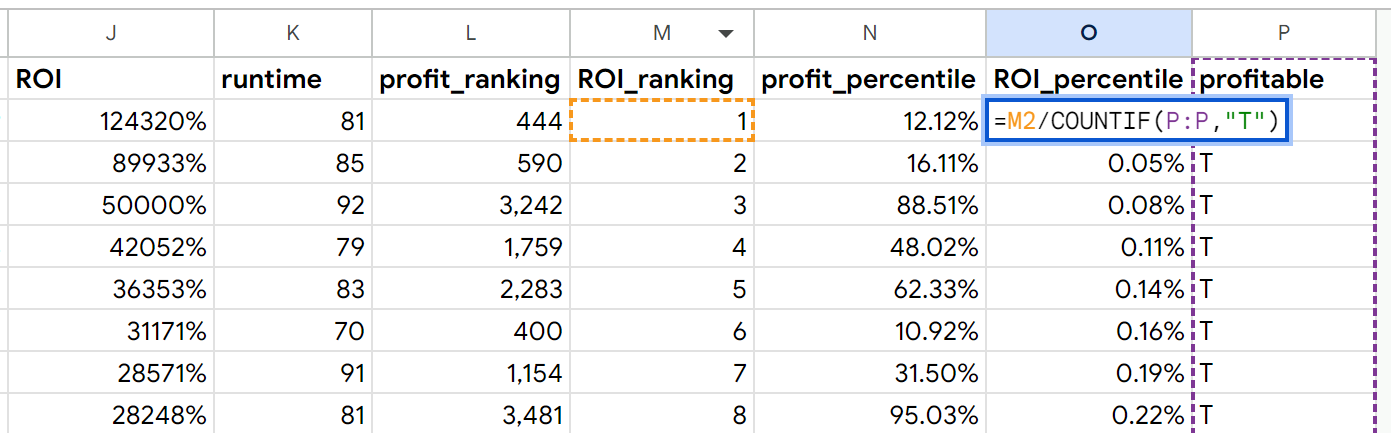
=M2/COUNTIF(P:P,"T")
Having finished this, we’re now ready to analyze the data.
Analysis
Breakdown by Genre
To start things off, I’d like to create a breakdown of all films by genre. So, I’ll list out each genre and calculate the percentage of films tagged with each genre.
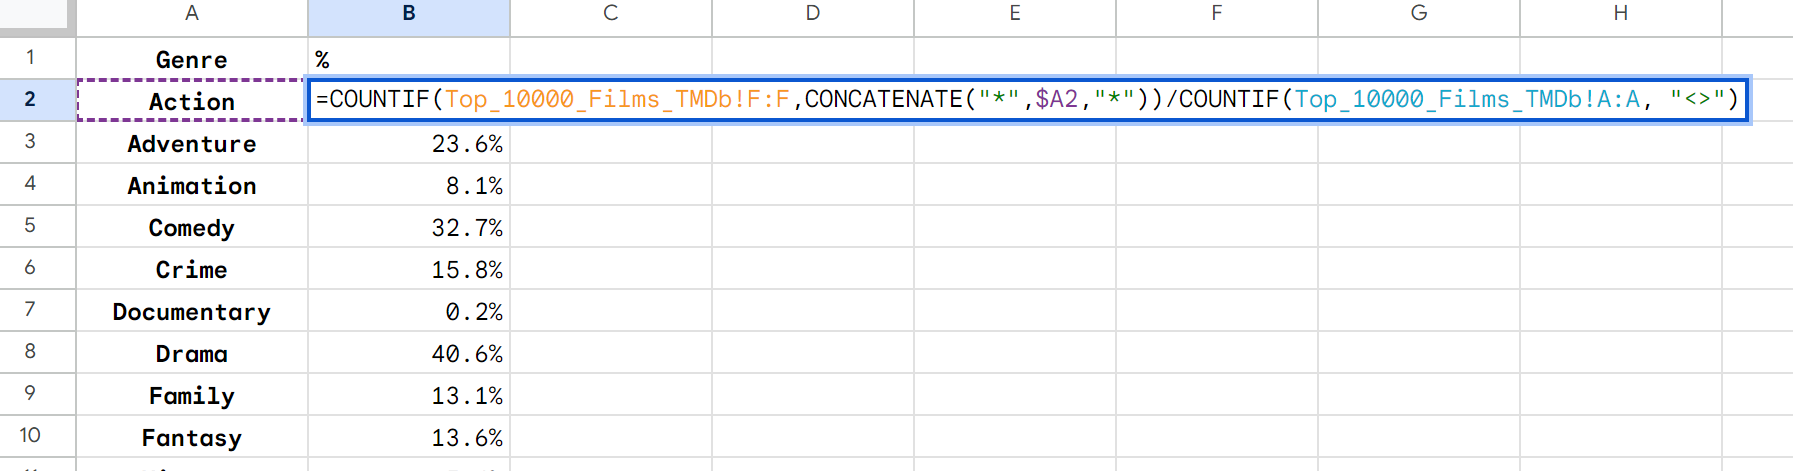
=COUNTIF(Top_10000_Films_TMDb!F:F, CONCATENATE("*",$A2,"*"))/COUNTIF(Top_10000_Films_TMDb!A:A,"<>")
This formula is using COUNTIF() to count all rows that contain the genre name (as found column A) and dividing it by the number of columns that contain any value. The CONCATENATE() function is used to add asterisks before and after the genre name, which enables the COUNTIF() function to count rows where the genre name is found anywhere in the string of genres.
Adding Dashboard Controls
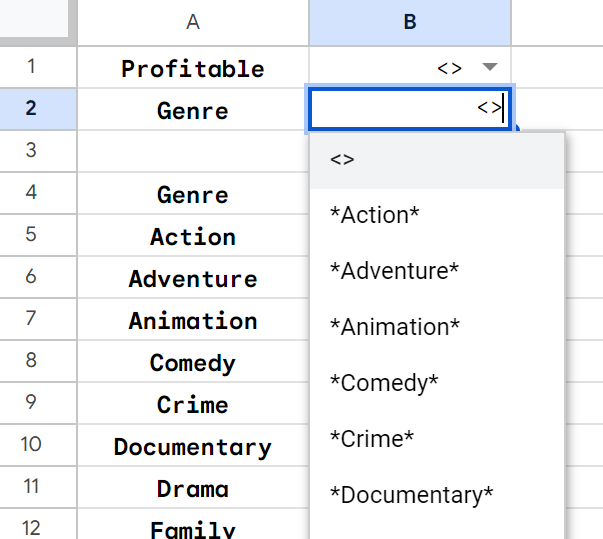
I want to add some functionality to this page. I’ll create two dropdowns: Profitable and Genre.
Profitable contains three values: <>, T and F. This will allow the stakeholder to filter by whether or not a film is profitable, or to include all films regardless of profitability.
Genre contains all genres as well as the <> value which will allow stakeholders to view all genres at once. The genres are wrapped in asterisks which seem to be necessary due to formulas we’ll be writing later.
We’ll need to edit our genre breakdown formula to take these controls into account.
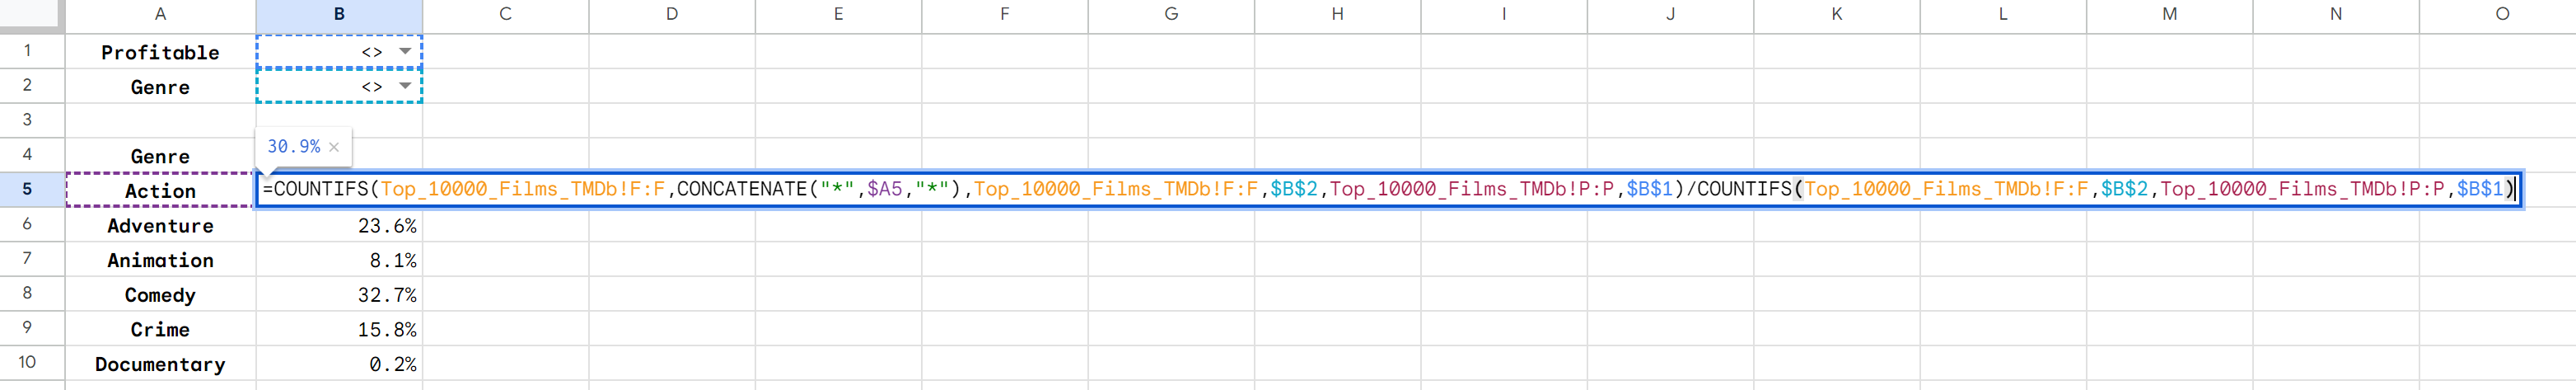
=COUNTIFS(Top_10000_Films_TMDb!F:F, CONCATENATE("*",$A5,"*"), Top_10000_Films_TMDb!F:F, $B$2, Top_10000_Films_TMDb!P:P, $B$1)/COUNTIFS(Top_10000_Films_TMDb!F:F, $B$2, Top_10000_Films_TMDb!P:P, $B$1))
This formula uses COUNTIFS() in the numerator and the denominator in order to find a percentage. The criteria that COUNTIFS() is checking is not only checking the genre value as it was before, but also the profitable and genres columns, which ties in the dropdowns to our formula.
Film Count
I’ll create a cell that counts the number of films that fit the criteria

=COUNTIFS(Top_10000_Films_TMDb!F:F,$B$2,Top_10000_Films_TMDb!P:P,$B$1
Averages by Criteria
I’ll now create some at-a-glance information about our selection, including Average Budget, Average Revenue, Average Profit, Average ROI and Average Runtime.

=AVERAGEIFS(Top_10000_Films_TMDb!I:I, Top_10000_Films_TMDb!$P:$P, $B$1, Top_10000_Films_TMDb!$F:F, $B$2)
This formula uses AVERAGEIFS() to take the average of a given column provided the conditions match, which in this case are the Profitable and Genre dropdowns. Budget, revenue, profit and runtime can all re-use this formula.
ROI must be calculated by dividing Average Budget by Average Revenue, not by averaging all ROIs in our dataset.
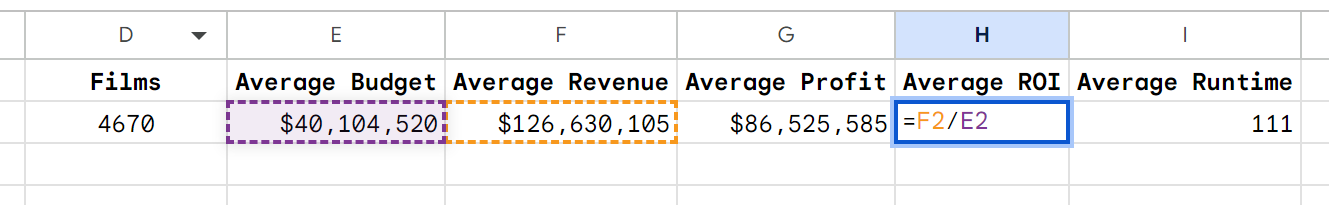
=F2/E2
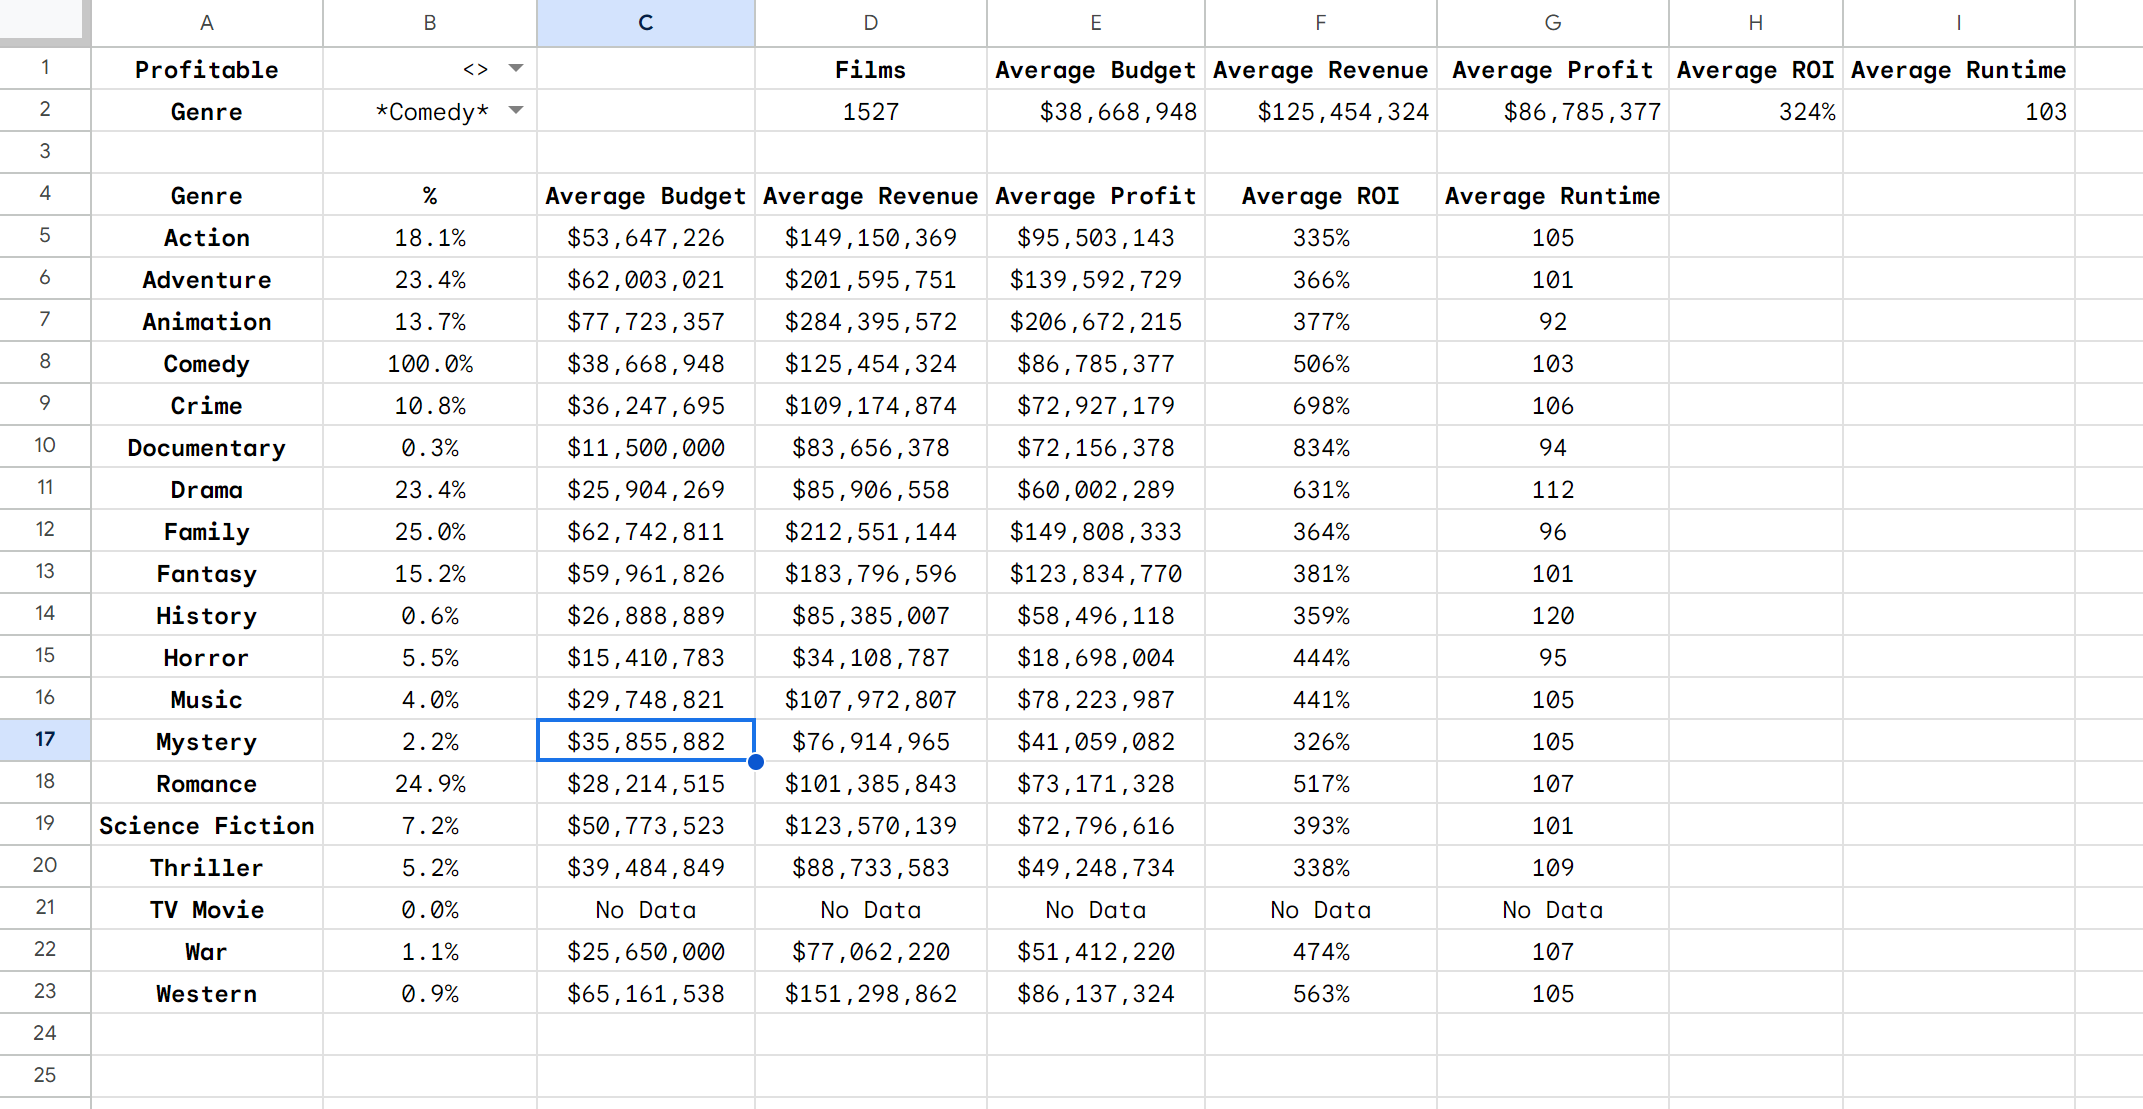
Averages by Genre with Controls
Now, I’ll be creating these same figures (Average Budget, Revenue, Profit, ROI and Runtime) for each genre. The AVERAGEIFS() function is used again here, only adding an additional criteria which is each genre in the breakdown. Also, IFERROR() is used to replace any DIV/0 errors with “No Data”.
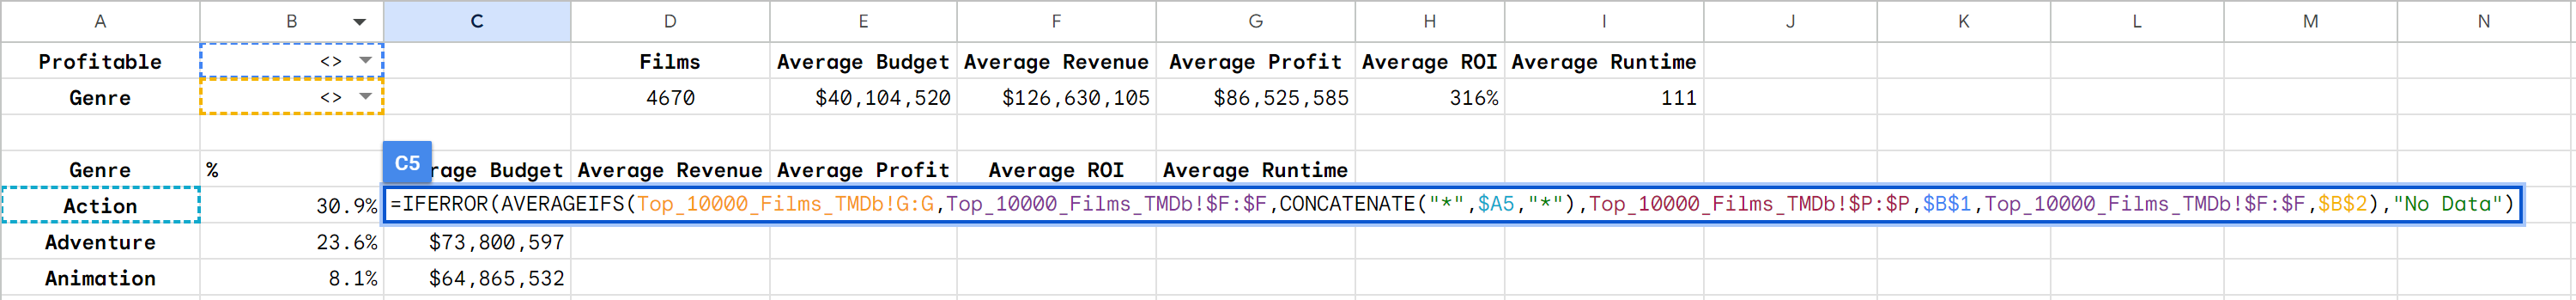
=IFERROR(AVERAGEIFS(Top_10000_Films_TMDb!G:G, Top_10000_Films_TMDb!$F:F, CONCATENATE("*",$A5,"*"), Top_10000_Films_TMDb!$P:$P, $B$1, Top_10000_Films_TMDb!$F:$F, $B$2), "No Data")
This process is re-used to form the Revenue, Profit, and Runtime columns. Again, the average ROI is found by dividing Average Revenue by Average Profit.
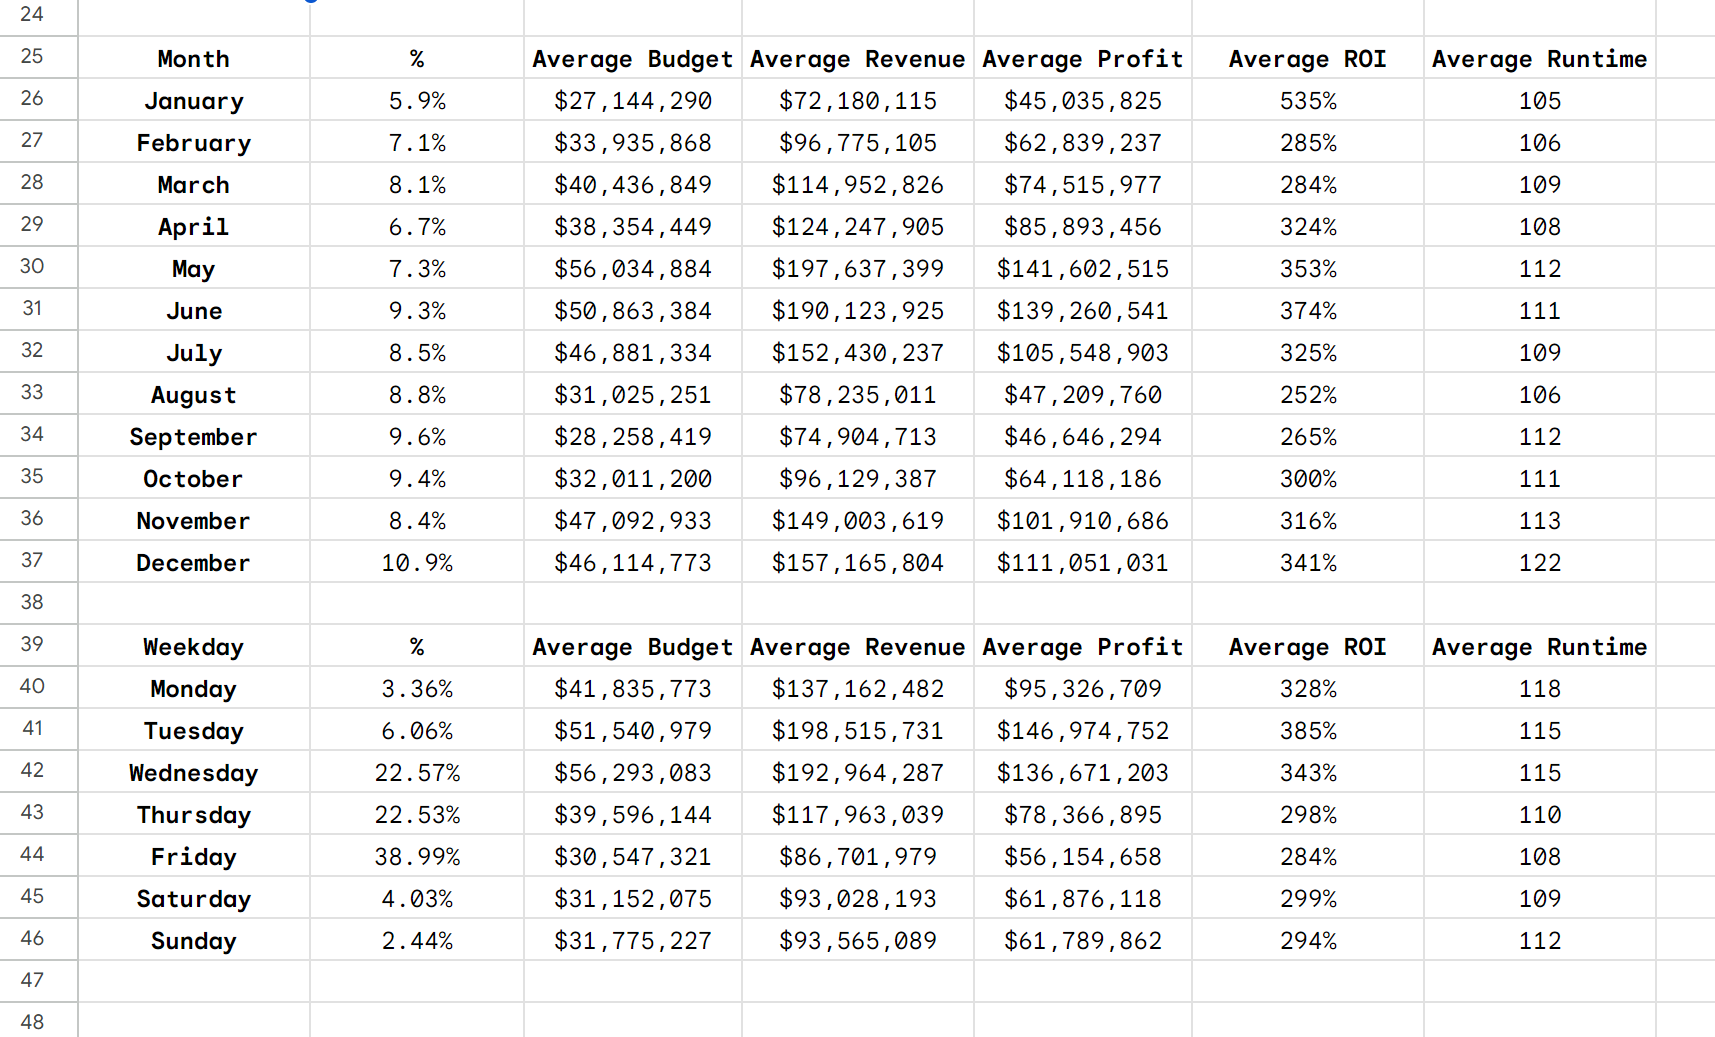
Averages by Release Month and Weekday
The steps taken above can be used once again to create two more tables: Month and Weekday. Instead of checking whether the film matches the genre in the A column, it will check whether the films were released in the given month or weekday
Adding Percentile Controls
Before we move on to the visualizations, remember when we made those percentile columns? It’s time to put those to use.
Our formulas are going to look similar to before, only instead of referencing a Genre dropdown at the top of the sheet, it’s going to reference a value between 1-100, and will check it in comparison to our respective Percentile columns.
The following criteria/criterion pair is what I’ll use for this. Top_10000_Films_TMDb!$N:$N,CONCATENATE(“<=”,$B$1,”%”)
In this case, the N column is our profit_percentile column and $B$1 is the cell that contains our desired percentile value.
CONCATENATE() appends <= and % to our number to make it compatible with our profit_percentile values
In context it looks like this:
=IFERROR(AVERAGEIFS(Top_10000_Films_TMDb!G:G, Top_10000_Films_TMDb!$N:$N, CONCATENATE("<=",$B$1,"%"), Top_10000_Films_TMDb!$P:$P, "T", Top_10000_Films_TMDb!$F:$F, $B$2, Top_10000_Films_TMDb!$F:$F, CONCATENATE("*",$A61,"*")), "No Data")
I’ve reproduced our tables from earlier onto two additional sheets. One sheet represents the top profiting percentile by dollar amount, the other represents highest profitability.
Data Visualized
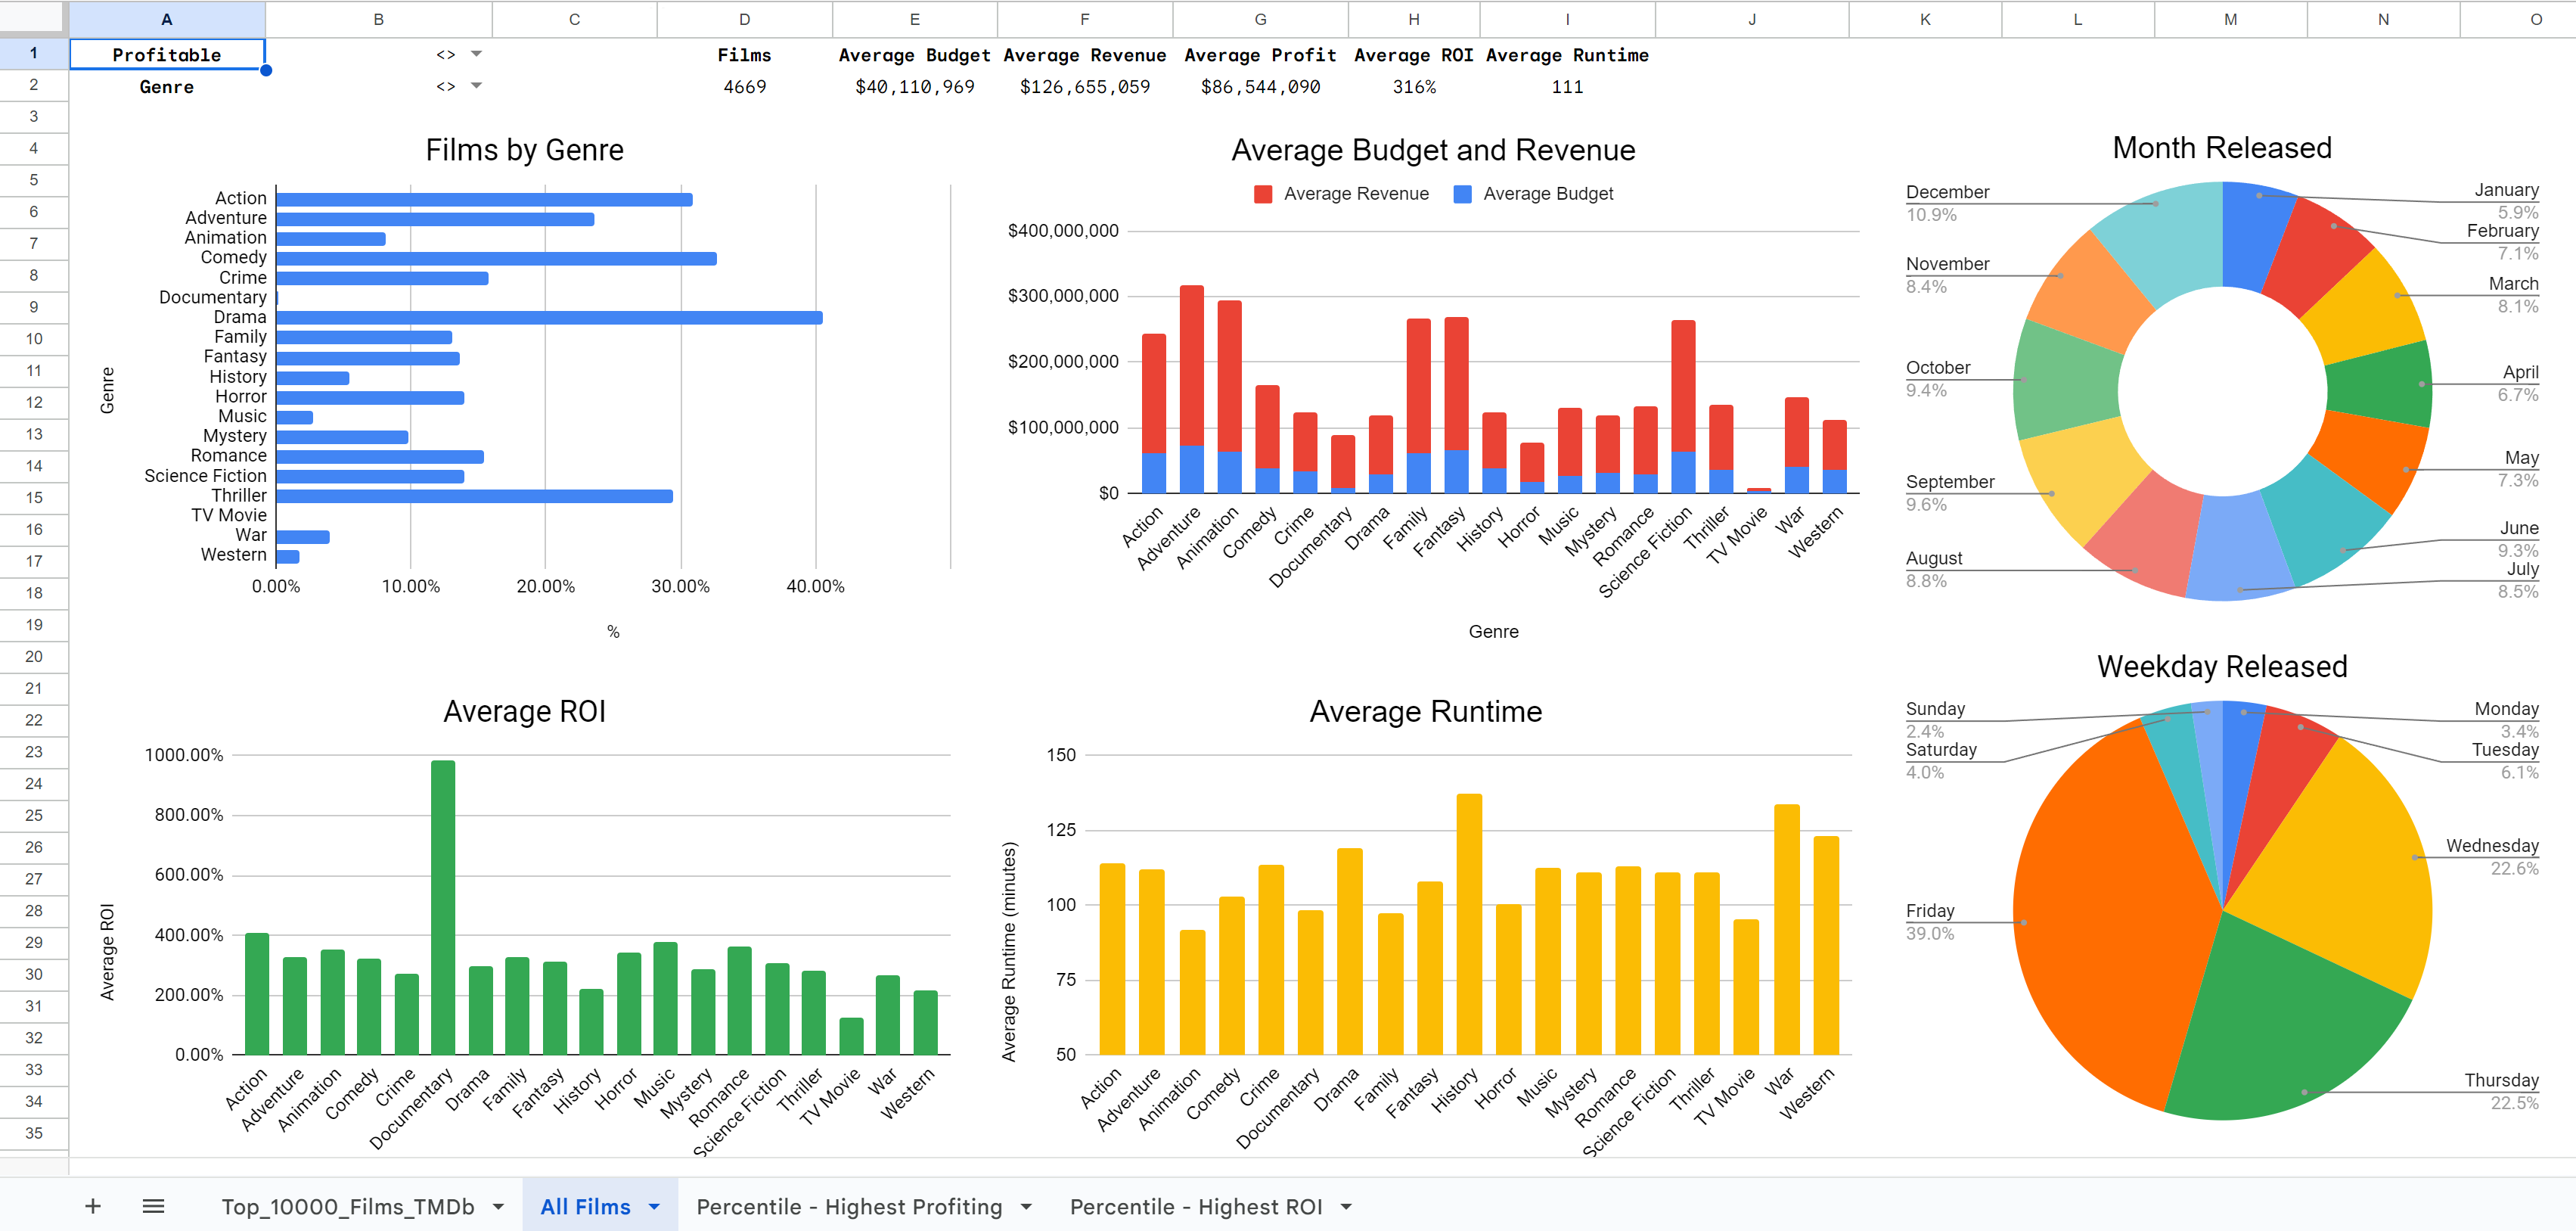
Dashboard 1: Complete Overview
Our first dashboard is an overview of the entire dataset with some additional functionality. Before any customization, this sheet will show data on all films, including average budget, average revenue, average profit, average ROI and average runtime. It also uses charts to show most popular genres, average budget and revenue by genre, most popular release months, average ROI by genre and average runtime by genre.
This same sheet can be used to visualize other segments, allowing the stakeholder to view:
- Only films that were profitable
- Only films that were unprofitable
- Only certain genres
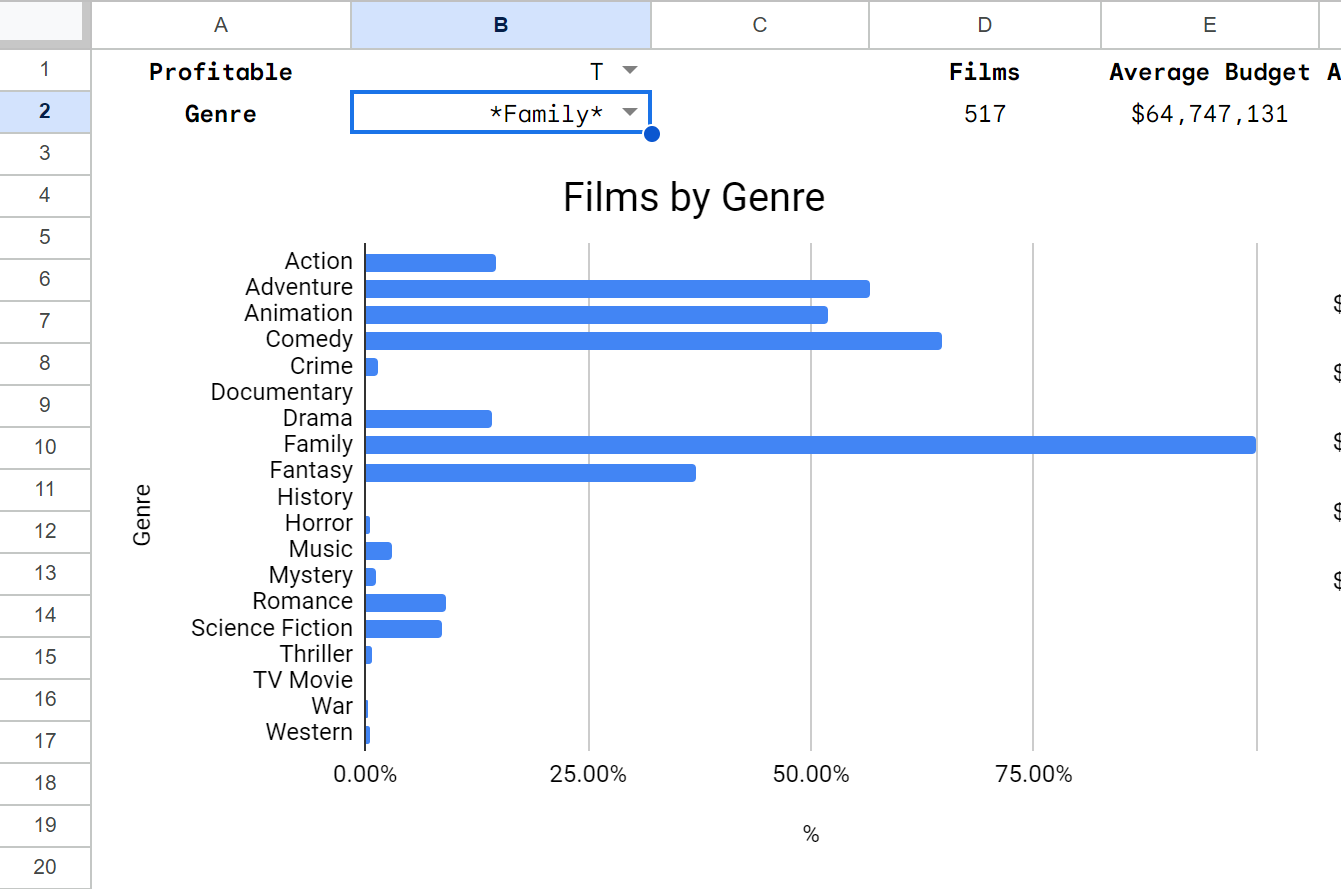
This allows stakeholders to see most popular genre pairings. For example, with this selection, a stakeholder can clearly see that profitable family movies are most likely to also be comedy, adventure, action and fantasy films.
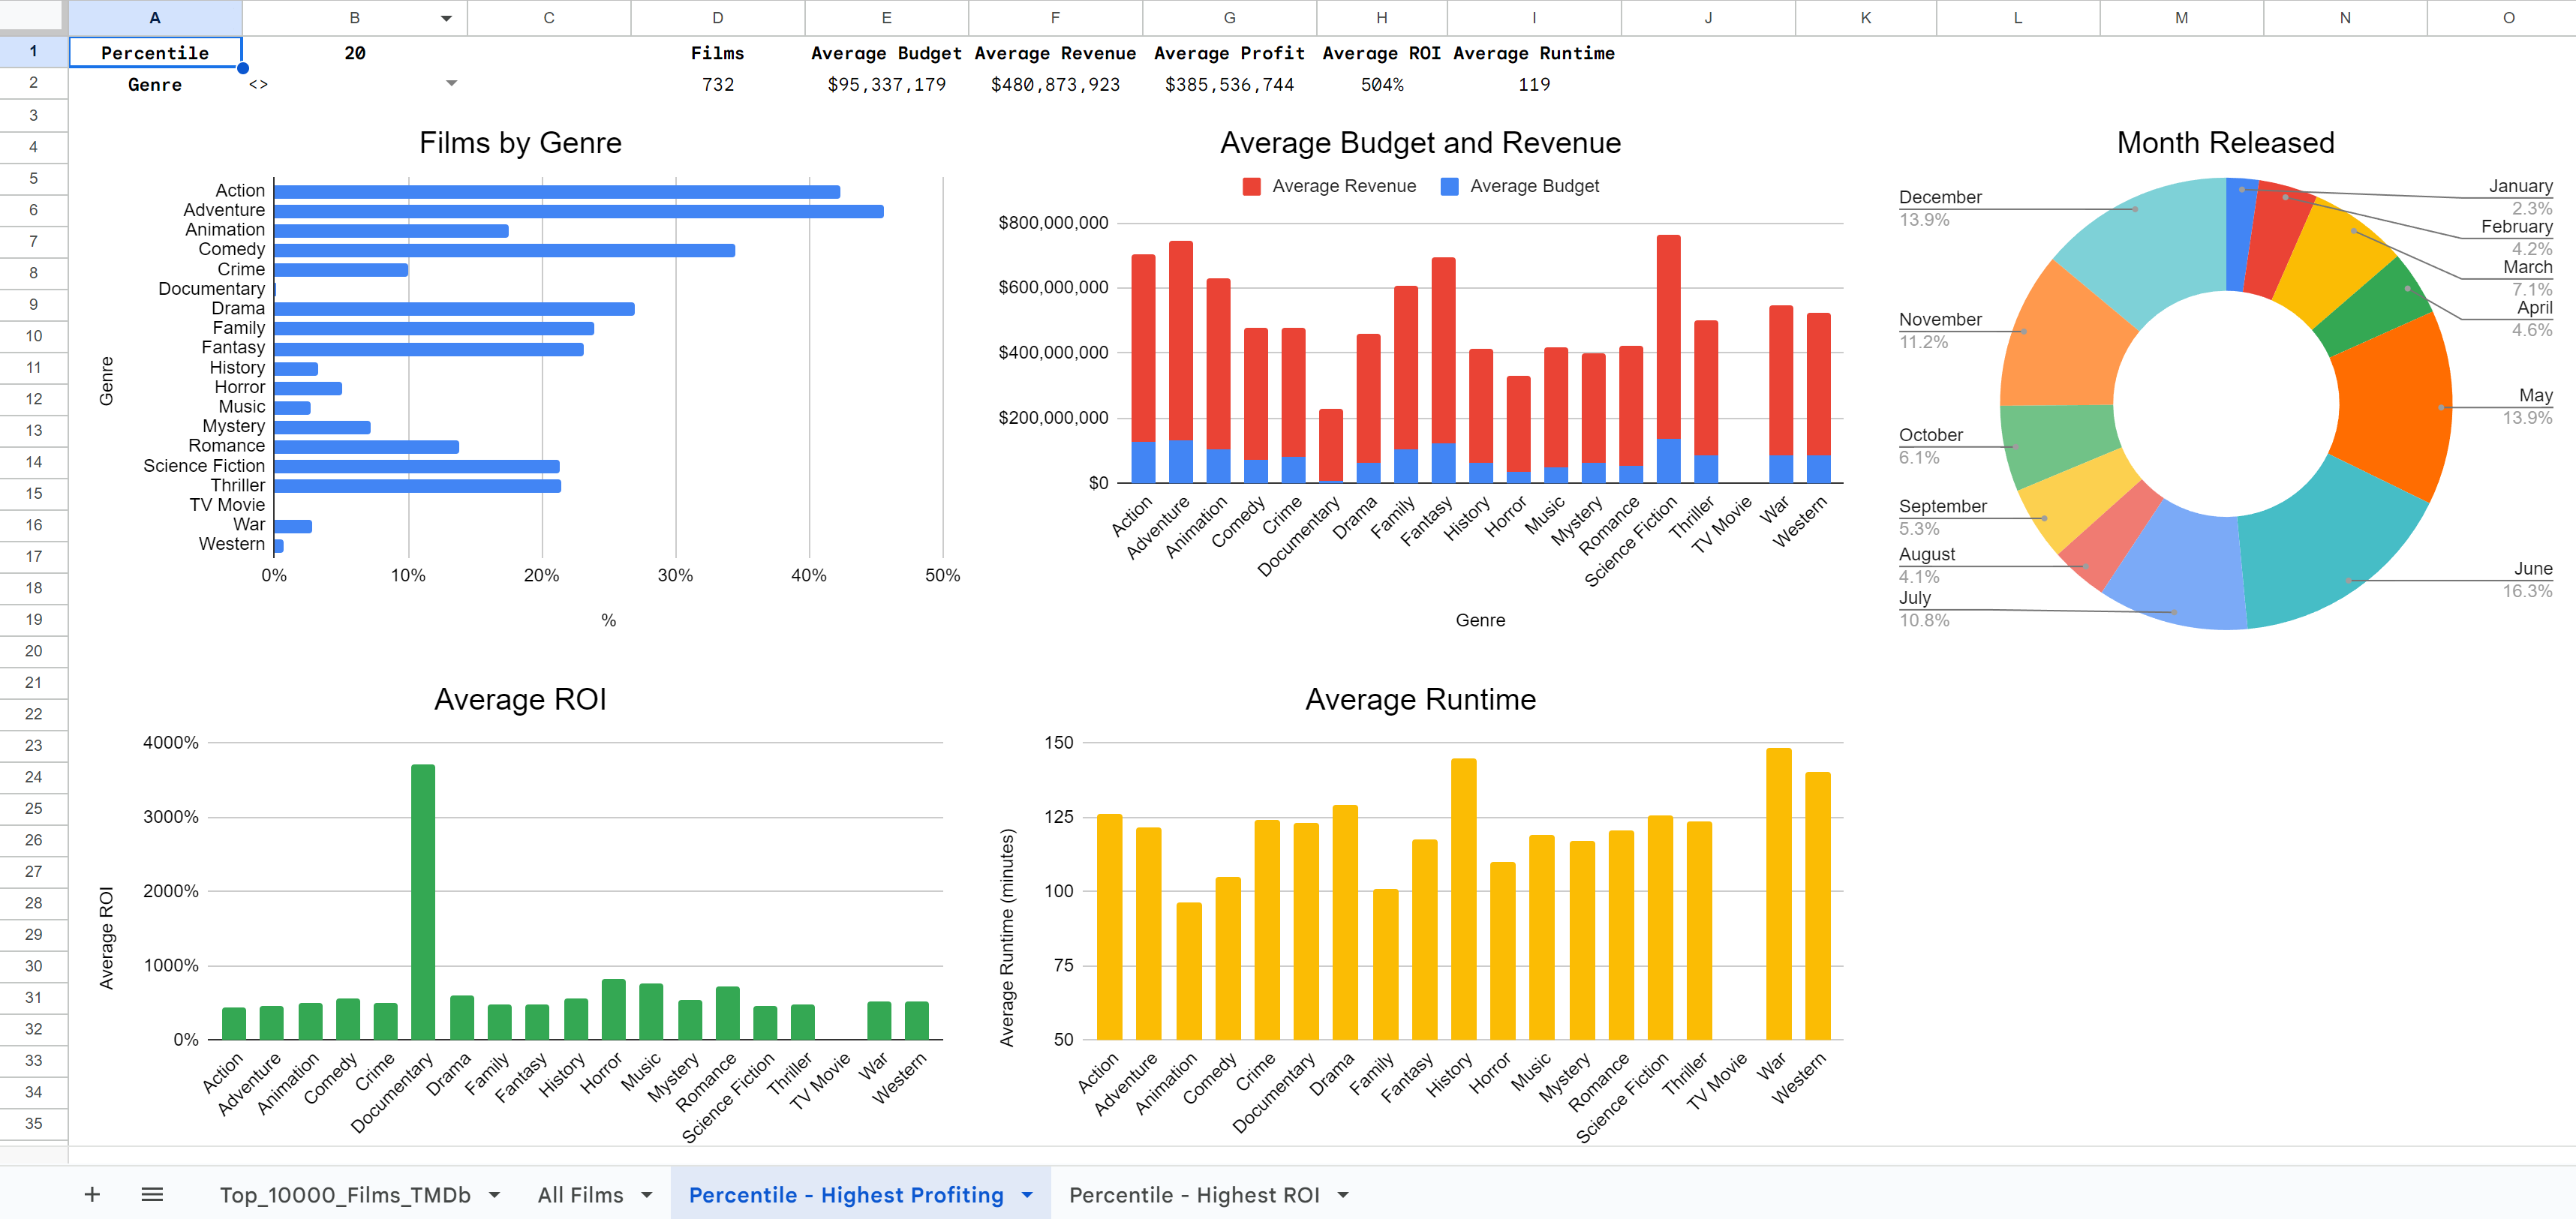
Dashboard 2: Top Performers by Highest Profit
Our second dashboard allows the stakeholder to see the top performers when it comes to the amount profited. In this selection, the stakeholder can see that of the top 20% of highest-profiting films, the most popular genres are adventure, action, and comedy.
Dashboard 3: Top Performers by Highest ROI
Our third dashboard shows the top performers in terms of ROI. The top 20% films with the highest ROI are most likely to be drama, comedy and thriller films.
With that, it’s time to finally draw our conclusions and provide helpful insights and recommendations.
Key Findings
- The most popular genres are Drama, Comedy, Action and Thriller
- The most expensive movies to produce are Adventure, Fantasy, Animation and Science Fiction
- The movies that earn the most profit are Adventure, Animation, Family and Fantasy
- The movies that have the highest ROI are Documentary, Action, Music and Romance
- The most popular months for films to release are December, September, October and June
- The most popular weekday for films to release are Wednesday, Thursday or Friday
- The longest films are History, War, Western and Drama films
- The shortest films are Animation, TV Movies, Family and Documentaries.
- Of the films that earned the most profit, most are Action, Adventure, Comedy, or Dramas
- Of the films that are most profitable, most are Drama, Comedy, Thriller or Horror
Recommendations
- If large amounts of funding is available, I recommend creating an adventure film with action elements. Popular films in this style are often fantasy or science fiction. This film should be close to 122 minutes in length, and release sometime in May or June.
- I suggest raising $131M in capital. If the film is a success, you could hope to profit $483M, which is an ROI of 468%
- If funding is not as easily available, I recommend creating a dramatic film with romantic and comedic elements. This film should be about 119 minutes in length, and release sometime in December or November.
- I suggest raising $14M in capital. If the film is a breakout hit, it is possible to earn profits as high as $150M, which is an ROI of 1229%
- Another option that could yield high returns is the thriller/horror genre. With an average budget of $13M and average length of 108 minutes, other films have earned an average of $140M, or an average of 1204% ROI. These films are popular in October, September and June.