
UCI E-commerce Sales Analysis
Business Analysis Report - GitHub Repo
Overview
This project analyzes a dataset of transactions from a UK-based online store to identify answers to key business questions. By cleaning the raw data and applying business metrics, I uncovered trends that can help drive inventory and marketing decisions.
Key Insights
- Organize around seasonality: Order volume increases significantly in advance of Q4, with Fall gaining £1.3M in total revenue compared to other seasons in 2010. Resources should be allocated accordingly.
- Protect high-value customers: 15% of all revenue is generated by just 8 customers. Due to this significant customer concentration, care must be taken to maintain good relationships with key clients.
- Review high-return products: While the overall gross revenue lost to returns is a healthy 5.75%, consider discontinuing SKUs with over a 25% return rate, as they account for just 1.6% of all products.
- Focus on emerging markets: Though the vast majority of revenue (85.9%) is generated in the U.K., nearby markets such as France and Germany show promise, demonstrating 200%+ growth over this period.
Business Questions Answered
I sought to answer the following critical business questions
- How has monthly revenue evolved over time?
- Is there evidence of seasonality in sales?
- What is the average order value, and how has it changed?
- What share of revenue comes from repeat customers?
- How concentrated is revenue among customers?
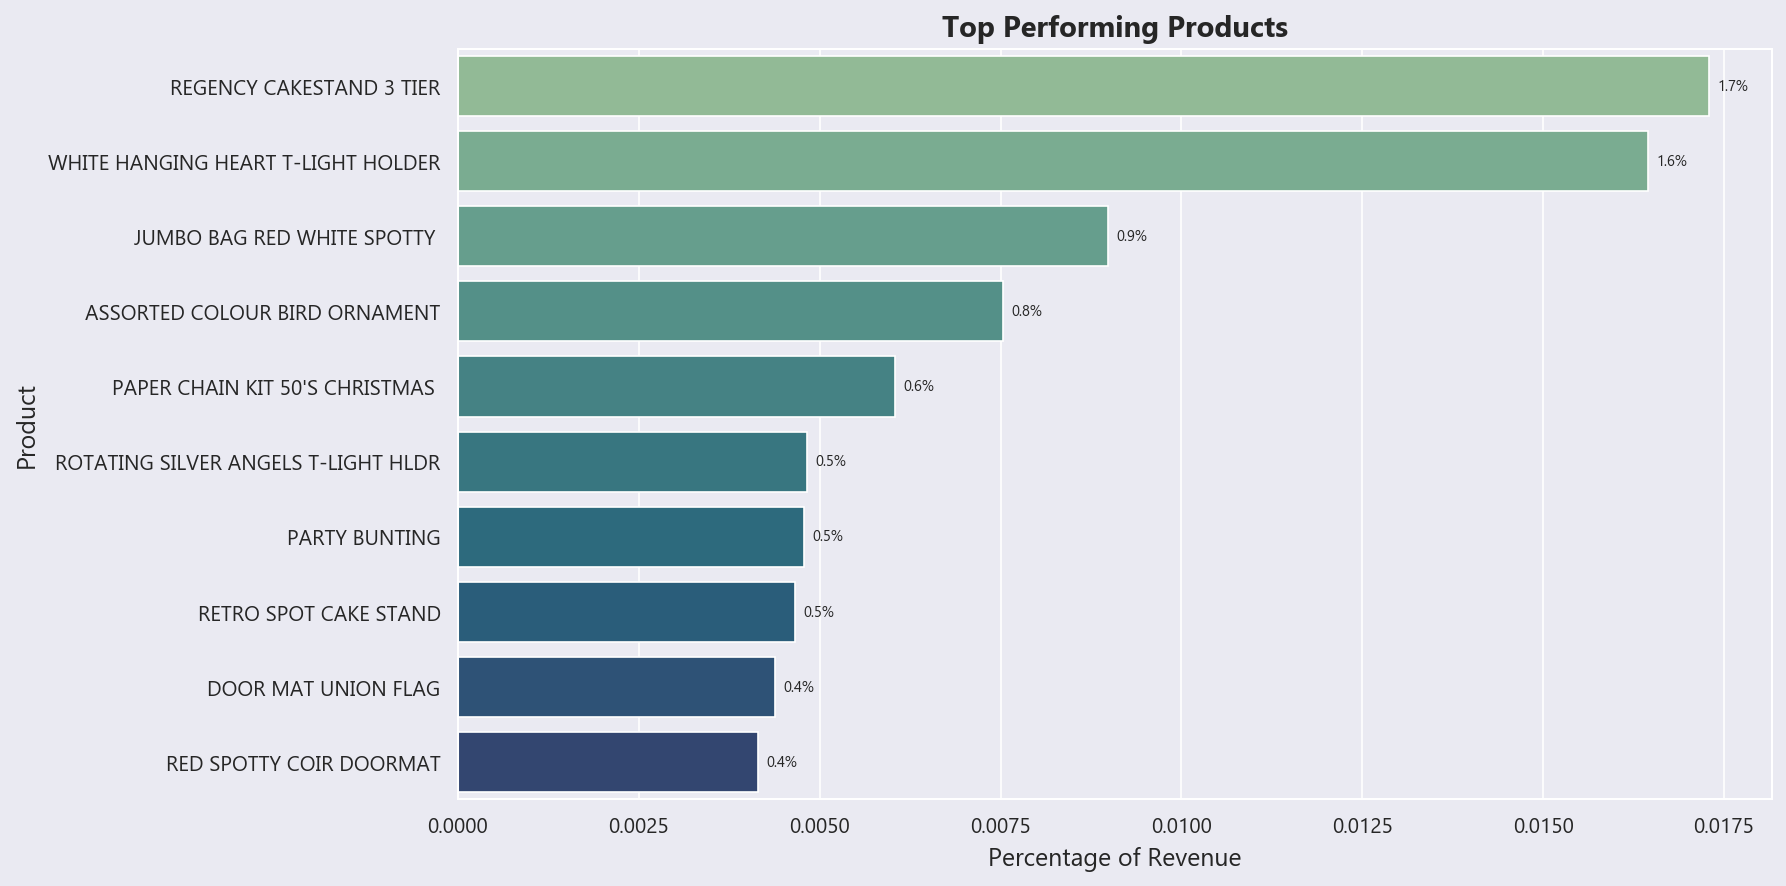
- Which products drive the majority of revenue?
- What percentage of gross revenue is lost to returns?
- Which products have disproportionately high return rates?
- How is revenue distributed geographically?
- Are certain markets growing faster than others?
The Data
The dataset details e-commerce sales and returns between 12/01/2009 and 12/09/2010. It was authored by Daqing Chen and published by the University of California, Irvine.
| Column | Description | Example Value |
|---|---|---|
| Invoice | Invoice number. Cancellations begin with ‘C’ | 491633 |
| StockCode | Code that uniquely identifies product ordered | 48195 |
| Description | Description of product ordered | DOOR MAT GREEN PAISLEY |
| Quantity | Number of units ordered per transaction | 2 |
| InvoiceDate | Date and time of invoice | 2009-12-11 15:37:00 |
| Price | Per-unit price in sterling | 6.75 |
| Customer ID | Number that uniquely identifies customer | 17958.0 |
| Country | The country the customer ordered from | United Kingdom |
Approach & Tech Stack
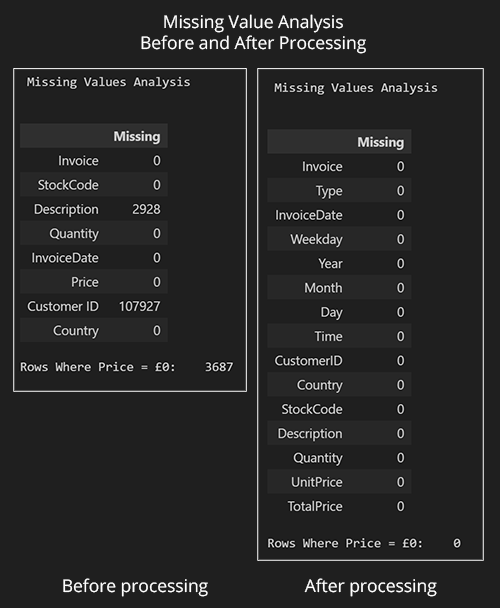
Analyzing this dataset required data cleaning, missing value imputation, and feature engineering before performing Exploratory Data Analysis (EDA) and generating business insights.
- Language: Python
- Libraries: Pandas, Matplotlib, Seaborn, NumPy
- Tools: Jupyter Notebooks, Git/GitHub, VS Code
Process
Missing value analysis before and after processing:
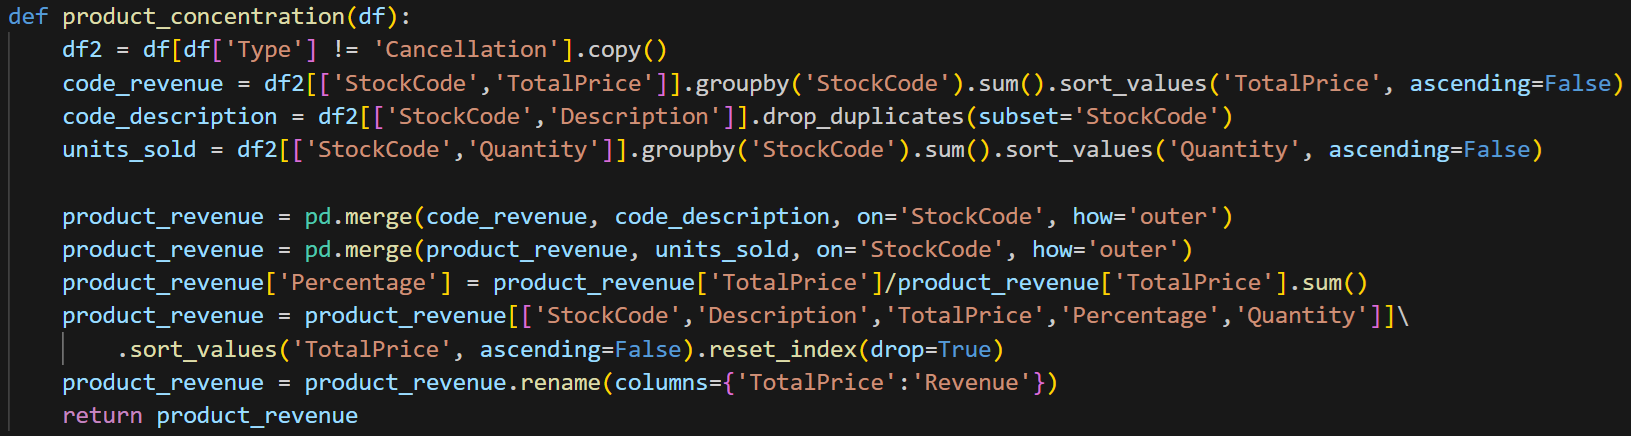
Function definition for ranking products by concentration:
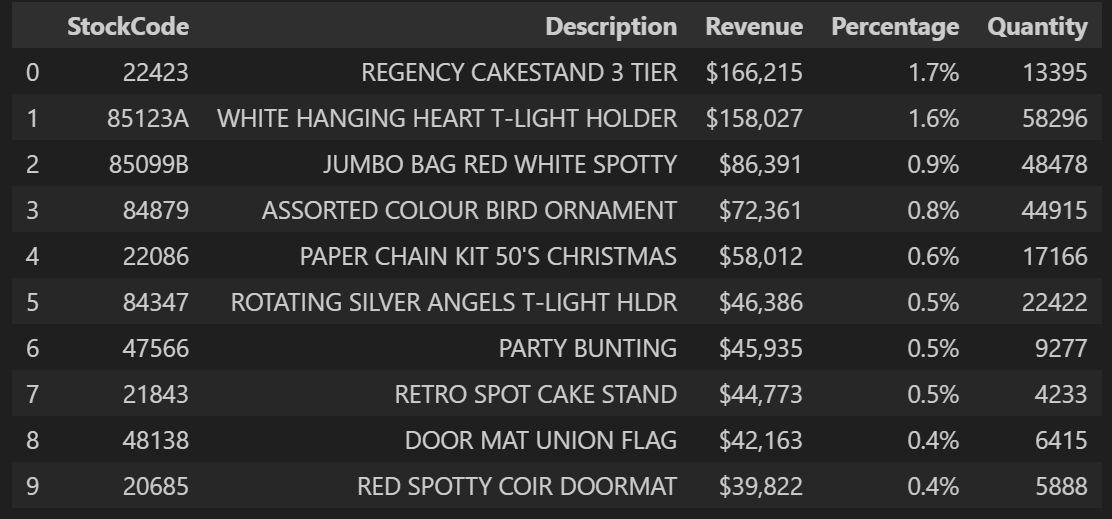
Product concentration table:
Product concentration, visualized.